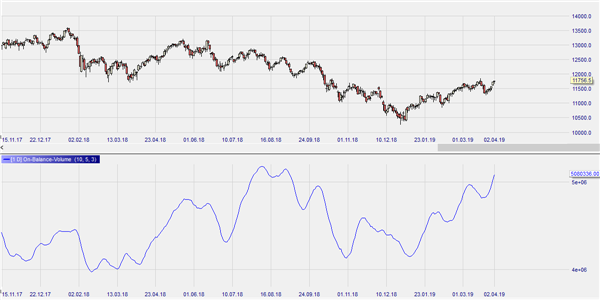
Joseph Granville’s On-Balance Volume indicator deals with prices and market volumes that are quoted daily. Volumes related to the current day’s rising prices are seen as Buy Volume, while those related to lower prices are taken as Sell Volume. The balance of both is the On-Balance Volume. Some analysts apply a Moving Average to the OBV as a signal line.
A rising OBV indicates an improvement of a stock’s technical position, and a falling OBV a deterioration.
The interpretation of the OBV depends on the price development:
| Price | OBV | Interpretation |
|---|---|---|
| + | + | Distinct uptrend |
| + | = | Moderate uptrend |
| + | - | Weak uptrend, near turning point |
| = | + | Accumulation period (bottom) |
| = | = | Uncertainty |
| = | - | Distribution period (top) |
| - | + | Weak downtrend, near turning point |
| - | = | Moderate downtrend |
| - | - | Distinct downtrend |
It can generally be stated that a rising OBV trend indicates a technically healthy stock, whereas a falling OBV trend suggests the opposite.
It is also interesting to mention 'gaps'. If the OBV suddenly rises or falls dramatically, then a correction may be expected.
Click here to get a free demo account.
PARAMETERS
- Moving Average period
BUY AND SELL SIGNALS
Buy and sell signals when the OBV crosses the Moving Average.
DIVERGENCE
Yes
INDICATOR TYPE
Volume indicator

