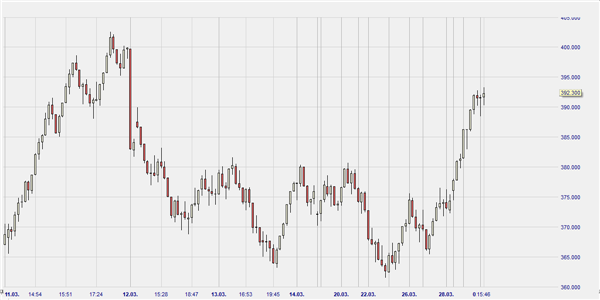
A Range Bar chart is based on price movements and is time independent. A range bar is complete when it reaches a set range. When prices are stable, no new bars are formed.
PARAMETERS
- Range
BUY AND SELL SIGNALS
N/a
DIVERGENCE
N/a
INDICATOR TYPE
Trend-following
This example shows a range bar chart of 3.5. Every new bar is formed when a range of 3.5 points is exceeded. Because the chart is completely time independent it tends to be show a much more price based rather then time based structure.


