
Many break-outs are nothing more than bull or bear traps. Candlestick formations can help reveal these traps and turn losing trades into winners. After a rally, you watch a stock move sideways. It moves regularly between the distinct resistance and support lines. Patiently you wait for the breakout, which should determine the further direction of the stock. The next day it happens: The stock goes through the resistance and closes one point above it. The day after, the stock opens with a gap to the top, and trades another point above the close of the previous day for half of the day. Two hours before the close of trading, the share is still strong and new highs are increasingly likely.
You go long and place a stop just below the former support level. The stock immediately moves in your direction and reaches new highs for the day. A movement in your direction for several days becomes more and more probable.
In the last 45 minutes of the day, however, the share begins to go a little lower, approaching your entry point. It finally closes just above yesterday's closing price. No big deal, you think. A few profit-taking after such a move is normal. The next day the stock opens higher again and you feel relieved. But your good mood doesn't last, because after ten minutes the stock is lower again. And it continues to go south until the day is finally over.
Two days later you are stopped and you wonder what hit you: The market has played you a classic. The bullish breakout has promised a new uptrend, only to quickly turn around and force the long to cover. In other words, you've fallen into the bull trap.
More than 100 indicators are available in the NanoTrader with one click as well as more than 60 ready-to-use strategies for direct use. You can test them immediately and free of charge.

Bull and bear traps have trapped insecure traders since the beginning of the financial markets. However, if traded cleanly, these traps can be among the most reliable chart formations. One way to turn bull and bear traps from disadvantage to advantage is to use the trap as a tool to turn the situation from bad to good. Many outbreaks are nothing more than bull or bear traps. Candlestick formations can help to point out these traps and to turn losing traps into winners are candlestick formations inside the traps. You trade them in the opposite direction - you use a bull trap as a selling opportunity and a bear trap as a buying opportunity.
Watch your step
Bull and bear traps occur at support and resistance levels. Resistance - a level where rising prices have turned in the past - is like a ceiling above the market. Support - a level where falling prices have turned in the past - is like a floor below the market (see Figure 1). A breakout above a resistance is usually bullish. Buyers have taken control of a level that was previously controlled by sellers. A breakout below a support is usually bearish. The sellers are now responsible for a level that was previously owned by the buyers. In a bull trap, prices break out above the resistance but collapse shortly thereafter, leading the new buyers into the trap (Figure 2A). In a bear trap, prices fall below a support level, but soon turn upward again, fooling the new sellers (Figure 2B). Candlestick reversal formations often signal that the breakout is more likely to be a trap than the continuation of an existing trend.
If a bearish reversal formation occurs the day after the resistance breaks, traders should close their long positions and bet on falling prices instead. After prices have fallen through a support, bullish candlestick reversals can indicate that traders would be better off closing their short positions and betting on rising prices.
Support and resistance lines.
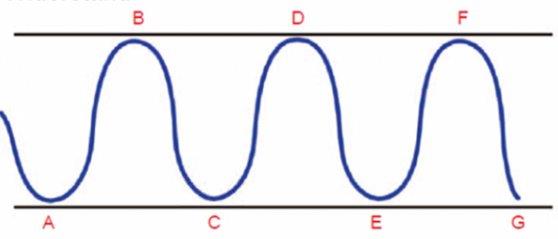
Support is like the bottom of the market and keeps prices from further losses; resistance is like a blanket over the market. Prices test support at points A, C, E, and, and resistance at B, D, and F.
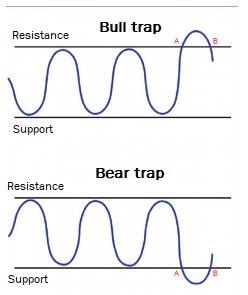
On the upper chart the price goes above resistance A, only to fall back below it at B (which should be the new support). The price's journey across the resistance became a bull trap. In the lower chart, prices breached support at A, but climbed back above the new resistance at B. The short term breakout turned out to be a bear trap.
Examples of bull traps
Figure 3 shows a bull trap that occurred after prices broke the resistance of two previous highs. The first upswing stopped at A. The candle after A is a Harami, a candle with a small candle body that is inside the candle body of the previous candle. A Harami shows that the prevailing uptrend is unlikely to continue before a consolidation or correction. The candle after the Harami is a bearish engulfing line, a large black candle that opens above the body of the previous candle and closes below it. This bearish engulfing line is another sign that the selling pressure at current levels is greater than the buying pressure.
PIC 3: Bearish Engulfing Line

Here prices turned to A after a Harami, the rise to B was stopped by a bearish engulfing line and the breakout above the resistance at C was stopped by another bearish engulfing line.
The second upward move ends at candle B, another bearish engulfing line. The prices went down again, forming a series of candles with small candlesticks grouped around the low at Candle B. At C, prices rose above the resistance, forming a white candle that closed near its high. The bulls had apparently taken control, but the next day the bears took the initiative again and another bearish engulfing line formed.
The line connecting the two highs at A and B acted as resistance - as the ceiling of the market. After Candle C, this former resistance line was supposed to become a support (a floor below the market), but Candle D crashed through the floor, opening a new downtrend. The bearish engulfing line warned of the bull trap and was a warning for traders who had bought C candle (or the opening of D) to limit losses and open short positions when D closed or the next candle opened.

In picture 4 point A marks a dark cloud cover. This is a candle that opens above the high of the previous candle, but closes inside the body of this candle. This indicates a reversal of the bullish market momentum and implies resistance at the high of the dark cloud cover. After a five-day sell-off, the stock begins a rally again and closes above the resistance at Candle B. Many traders would have bought on the assumption of further rising prices at the close of B or the opening of C. In fact, the open of C is very bullish, forming a gap above the high of the previous candle. However, at the close of C, the market looks much less bullish: C has a long upper shadow, a small candle body close to the day's low, and the gap between the candle bodies of B and C makes Candle C a shooting star, a bearish reversal formation.
FIG 4: Shooting Star and Hanging Man

The shooting star at C and the hanging man at D led to the bull trap. The escape failed at E and the new resistance was tested by the long upper shadow at F.
Candle D is a Hanging Man, another bearish formation. A Hanging Man has a small candle body near the high of its span, no or only a small upper shadow and a long lower shadow. The Hanging Man itself is bullish: prices fall during the trading day, but then rotate and close near the Open and the High (the opposite of the previous candle - Shooting Star). The Hanging Man becomes bearish, however, when Candle E, a large black candle, closes below the low of the Hanging Man.
At bar D, the price temporarily falls below the extended old resistance line (new support line) of candle A, but can close above it. Candle E, however, not only falls below it intraday, but also closes below the line. The shooting star, the hanging man and the weak closing price below the support line provide enough reasons to close the long positions initiated at B and to bet on falling prices at E.
Note also how the intraday rally of F failed and turned around when the resistance line was touched. The line that was considered resistance since A became support at B and served as resistance again from F.
In picture 5, prices go lower after forming a new high in the uptrend at point A. The candle B tests this level again, but closes well below the resistance level. Candle C is then very bullish: It opens above the resistance and has no upper and lower shadow. The Open is the low and the Close is the high of the day.

On this chart, the breakout at C was taken out again the next day by a dark cloud cover. The following window (gap) between the low at D and the high at E confirmed this bull trap.
PIC 6: Evening Star

Here the Evening Star Formation is formed by the candles D, E and F. They turn the eruption over the resistance at D into a bull trap.
Candle D however shows the high probability of a bull trap. It opens above the high of candle C, but closes deep inside the candle body of C, thus forming a dark cloud cover. Another indication that the breakout above the resistance could be a bull trap is the window between the low of candle D and the high of candle E. (A window is the candlestick counterpart of a gap; the low of D and the high of E do not overlap).
Breakout traders have probably bought at the close of C or the open of D, but they should have turned their long positions either at E or the opening of the next day. Once again, the candlestick formation identified the bull trap early enough to minimise losses from the long trade and profit at a short position.
Bull traps also occur on intraday charts, a 30-minute chart is a good example. The market tests resistance at points A, B and C, but every attempt fails. The candle D then closes well above the resistance line, and the old resistance becomes support.
The candle E tests the new support, but closes well above it. Candle F, on the other hand, a large black candle, breaks through under the support and closes near the daily low. Candles D, E and F also form a variation of an Evening Star, another bearish formation.
In an Evening Star, the first candle is a large white candle in an uptrend, the second has a small candle body with a gap away from the first candle body. The third candle is a large black candle that closes at least well in the candle body of the first candle. In this case the bottom of the candle body of candle E overlaps the top of the candle body of candle D a little bit, so there was not really a gap.
Nevertheless, Candle F traders who bought at D or E were warned of a potential bull trap. Disciplined traders should have taken their losses and initiated short positions long before the final price collapse.
Examples of bear traps
Picture 7 is an example of a bear trap. Note the long lower shadows of candles A and B: Prices turned sharply upwards again after testing support at 47. Candle C, however, closed well below the support, showing that the bears have taken control from the bulls. The old support becomes the new resistance. Prices made a new low at D, but candle E turned up and closed clearly above the new resistance. Candles C, D and E form a Morning Doji Star - one of the major bullish reversal formations. A Morning Doji Star begins with a large black candle in a downtrend. The candle body of the second candle (a doji is a candle where open and close are almost on the same level) forms a gap to the end of the previous candle. The third candle in a Morning Doji Star is a large white candle that closes at least well within the body of the first candle.
PIC 7: Morning Star Doji

Image 7: Note the long lower shadows on candles A, B, F and G that formed when prices fell below support. The Morning Star Doji is composed of the candles C, D and E and reverses the breakout below the support at C.
In this case, the third candle was particularly strong: its candle body closed well above (not just well inside) the candle body of the first candle. In addition, a gap formed between the candle bodies of the second and third candle. This gap between the second and third candle is not one of the requirements for a Morning Doji Star, but it makes the formation even more bullish.
Finally, note the long lower shadows on the F and G candles as prices tested their new support levels. The line resulting from the lows at A and B to G served as support until prices at C went down. It served as resistance until the Morning Doji Star at E was completed and it again served as support during the tests of F and G. Traders who had sold short at C received a clear signal from the Morning Doji Star to turn their positions and open long positions at the close of the candle E (or the open of F).
In Image 8, prices often fell to the levels of A, B, C and D, establishing this level as support. At E, prices closed significantly below this level, convincing many traders that a new downtrend is forming. The formation quickly became a bear trap as F closed well above the new resistance/old support. Candle F is a bullish engulfing line: Its candle body envelops the complete candle body of the previous candle. This bullish engulfing line was a strong sign that Candle E was a bear trap and prices would probably continue to rise. The advantage of flexibility Many experienced traders believe that breakouts over resistances and under supports are no longer consistent as they were a few years ago. Nowadays, bulls and bear traps seem to occur as frequently as valid outbreaks. However, one thing remains constant: traders must adapt to changing market conditions. If you get caught in too many bull and bear traps, you may want to let the original opportunity pass and consider taking advantage of opportunities in the opposite direction instead.
PIC 8 Bullish Engulfing Line

In this example the bullish engulfing line completed the bull trap and turned the breakout under the support upwards.
