
Most often, profits (but also losses if there are no stops) are made when there is a trend-oriented movement in a market. The correct assessment of the probable trend can therefore be extremely helpful and profitable. The Heikin Ashi technique combines the advantage of charting using Japanese candle charts with an improved representation of the prevailing trend direction.
In comparison to other forms of charting, Heikin Ashi charts are a comparatively young chart that entered the trader community only a few years ago. In their appearance they resemble the well-known Japanese candlestick charts. Their big advantage over the usual candle charts, i.e. to emphasize trends more clearly, will probably make them a natural part of technical analysis in a few years just as the traditional candle charts have been for 20 years.
Origin and meaning
Heikin Ashi-Charts became famous in 2004 through the Swedish trader Dan Valcu. The technique of this chart representation comes - like many other charts - from Japan. Valcu made the forgotten method accessible to the general public through a series of articles in various publications. In Japanese, "Heikin" means balance. The word "Ashi" means foot. Freely translated Heikin Ashi means "to balance on one foot".
Image 1: Difference Heikin Ashi and Candlestick

Image 1: Above you can see the Heikin Ashi chart and below the Candlestick chart of the Infineon share. You can clearly see that the Heikin Ashi chart is more consistent than the Candlestick chart.
Test and compare Heikin Ashi candles with candlesticks on the award-winning NanoTrader platform.

"The NanoTrader platform is magnificent." – Kai
"NanoTrader is my fourth trading platform and it is by far the BEST platform." – Henry
"I have already familiarized myself a little bit with the platform and I can tell you, that it is the best trading platform I have ever used." – Peter
The difference to usual candle charts
If you look at the chart of a stock or an index both as a candlestick chart and as a Heikin Ashi chart, you will hardly notice any difference at first glance. Heikin Ashi charts also consist of white and black candles. Their interpretation is identical to that of conventional candlesticks: White candles stand for periods with rising prices, black candles show periods with falling prices.
On closer inspection, however, it is noticeable that Heikin Ashi candles are often more uniform in their sequence than "normal" candle charts. This is because the Heikin Ashi methodology modifies candlestick charts. This modification is done by converting the existing open, high, low and close prices in such a way that smaller price movements are filtered out. The course of Heikin Ashi charts is thus a smoothed form of the usual candle charts.
This has the small, but not to be underestimated, advantage that both upward and downward trend patterns are visually more effective for the eye of the observer than is the case with the usual candle charts. The example in Figure 1 is intended to illustrate this.
The two-part chart shows the Infineon share over a period of three and a half months on a daily basis. While candlestick charts show a more frequent change between the white and black candles, which is irritating for many investors, the Heikin Ashi chart is more uniform. For example, the recent sharp rise in the stock is only "disturbed" by a single (small) black candle. An investor who entered this stock after the break of the downward trend with the appearance of the first long white Heikin Ashi candle (see arrow) was taken from possible doubts about the further holding of this position until today. Because white candles appeared continuously, which signaled to him that with the trend of this share still everything runs according to his expectation. The example shows very nicely how this technique can be used to filter out the price noise and minor irritations from the chart as far as possible.
The calculation of Heikin Ashi candles
The presentation of Heikin Ashi candles is based on a conversion of the regular prices like opening, high, low and close (OHLC). Table 1 shows the calculation rules of the individual price elements of a Heikin Ashi candle (ha). Since the Heikin Ashi opening price is the average between the opening price and the closing price of the previous day, the opening price of a Heikin Ashi candle is always in the middle of the candle body of the previous day. This means that there are no gaps in Heikin Ashi charts. In addition, prices can be displayed that were not tradable in the respective candle. Due to the conversions, the Heikin-Ashi values should therefore not be used for back tests, but always the actual price data.
Are you looking for an outstanding futures and CFD-Forex broker?
In the annual Brokerwahl traders voted WH SelfInvest as "Nr. 1 Futures Broker" and "Nr. 2 CFD Broker". For an incredible five times in six years WH SelfInvest is considered the best futures broker, beating all competitors by a wide margin. In CFDs WHSelfInvest came only 0,1 behind this year's first-placed broker. Clients are extremely satisfied with the low commissions, outstanding order execution and the legendary service.
Test WH SelfInvest, download a free demo.
Table 1: Calculation of Heikin Ashi candles
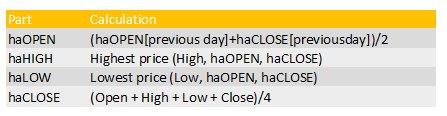
Table 1: For the calculation of the Heikin Ashi candles (ha) the four elements opening, high, low and close are used.
Interpretation of Heikin Ashi candles
The comprehension rules of Heikin Ashi charts are by far not as comprehensive as those of conventional candlesticks. Therefore, a thorough knowledge of candlestick formations, as they are often found in traditional Japanese candlesticks, is not necessary. In addition to the information a feeder receives about the colouring of the candle body, it also learns further details about the appearance of the candle. Strong upward trends, for example, are characterised by particularly long white candle bodies without lower shadows. Sharply falling prices are characterized by long black candles without upper shadows. If a predominant trend weakens, the candle bodies also become smaller. A consolidation is characterized by a series of smaller candle bodies with upper and lower shadows. A trend change is often accompanied by a candle with a very small candle body and long upper and lower shadows. Figure 2 shows an example of how Heikin Ashi charts signal an upward trend.
Picture 2: The euro from the Heikin Ashi candles' point of view

Picture 2 shows the euro against the US dollar over the last four months. The marked upward movement from mid-September to mid-October was interrupted only by a single black candle. In addition, it is very nice to see that the two large upward movements in this section were each initiated by the appearance of long white candles.

Bottom line
A Heikin Ashi chart shows upward and downward trends and depicts them as a sequence of white and black candle bodies. The Heikin Ashi method is not only a chart chart, but also an indicator that provides an excellent means of determining trend direction and strength. Due to the calculation methodology, the Heikin Ashi strategy is delayed by one to two days. This can be costly if you do not have appropriate risk and money management. Heikin Ashi charts, like other charts, can be easily combined with technical indicators to increase the accuracy of your strategy.
