
How to act successfully with the trend
There are countless trading methods that investors and traders can use to operate in the financial markets. One of the most commonly used trading techniques is the trend following approach. This method became famous in the 1980s with the spectacular success of the Turtle Traders trained by Richard Dennis. In this article, we therefore highlight the fundamental characteristics of this method and show under which conditions solid gains can be achieved on the stock markets with trend following approaches.
Essentially, we distinguish between two approaches to deriving investment decisions in the financial markets: fundamental analysis and technical analysis. Both have in common that money can only be earned if they manage to be on the right side of the big trends on the stock markets. In fundamental analysis, an attempt is made to assess the value of an investment on the basis of macroeconomic or business ratios (so-called fair value). This value must then be compared with the current price. If this is below the calculated value, the investment is expensive and therefore not worthwhile (overvalued). In the opposite case, the investment could pay off (undervalued).
Technical Analysis (TA) takes a completely different approach to the valuation of financial assets. It is based on three key assumptions, which we will look at in more detail below.
Technical Analysis: The Basic Assumptions
First, TA assumes that all information is already included in the courses. It therefore makes no sense to track down the latest corporate news or evaluate economic data from a wide variety of economies. Everything is already included in the prices. A technical analyst therefore only needs the historical price time series to prepare the analysis of a stock, foreign exchange or raw material, whereby the data on the trading volume is partly also included.
The second assumption is that the most varied developments on the markets are constantly repeated. TA tries to detect recurring patterns in the markets that are highly likely to have occurred at the beginning of a larger trend phase. Historical data is used to measure how successful an investment has been in the past if certain rules have been followed. If this analysis of the past - purely hypothetical - produces a result with a significantly positive mathematical expected value, the identified pattern can be used in practical trading.
It is assumed that future price developments will behave in a similar way as in the past: "History repeats itself". Those who find this statement too daring can also content themselves with the bon mot "History does not repeat itself - but it rhymes very well". Because the analysis of historical data only leads to probability statements à la Form: "When this or that formation appeared in the past there was a continuation of the trend with a probability of x percent! There will never be a certain statement in connection with the price development on the stock markets.
The third and final basic assumption of TA is that markets move in trends. Here, trends can point in three directions, which can be used profitably in a variety of ways: upwards, sideways and downwards (B1).
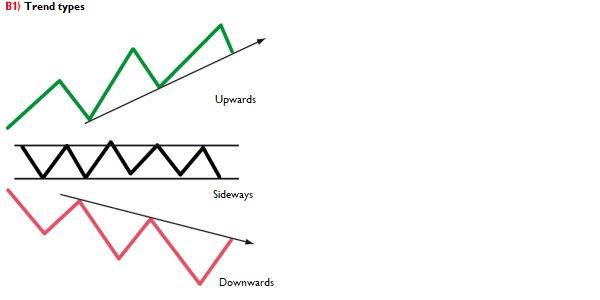

Image 1 (B1) shows the different types of trends: Trends can point in three directions: upwards, sideways or downwards. The upward trend is defined by a sequence of rising highs and lows, analogously a downward trend by a sequence of falling highs and lows. In a sideways trend, upward and downward movements occur within a range.
Trend Following as a Subarea of Technical Analysis
As the name suggests, trend-following investors - the so-called trend followers - always act in the direction of the prevailing trend. Since prices are not linear, the term "trend" refers to a series of highs and lows. An uptrend is defined as a series of rising highs and lows, and a downtrend as a series of falling highs and lows.
The trend followers follow the trend, i.e. remain invested in it until it changes. Accordingly, the trend followers always follow the trend, so that buy signals (end of a downward trend, start of an upward trend) and sell signals (end of an upward trend, start of a downward trend) do not occur until the new trend has established itself. Trend followers therefore react to a trend change with a more or less large delay and thus always relatively late.
Due to this delayed reaction, trend followers are quite successful in phases with longer-lasting and sustainable trends, while false signals accumulate in sideways trends. In these sawtooth markets, which are characterized by a heterogeneous development with only very short-term and narrowly limited upward and downward movements, the trend signals often occur shortly before the price changes direction again. The consequence of this is a chain of false signals, which only ends when the market again embarks on a clear upward or downward trend.
How do trends develop?
Trends can be found in almost all areas of life. In the areas of fashion, health, music, cars, travel and, of course, the stock market. All trends have a certain sequence of events in common. First of all, a few people start to take an interest in a certain thing. If, for example, more and more people gradually use an iPhone to make phone calls, then a trend will emerge. Strong trends become visible when you meet an increasing number of people who also use an iPhone.
So trends are a mass phenomenon. This is not a new phenomenon. It was already described very concretely in 1895 by Gustave Le Bon in his book "Psychologie des foules" (Psychology of the Masses) - a book still worth reading today because it is timelessly topical.
The formation of trends on the stock markets works according to the same scheme. At first, only a small circle of investors are interested in a particular share. As soon as the trading volume of the share exceeds a critical mass, more and more investors become aware of it. If, however, the demand for a share rises, the price will rise while supply remains constant - according to the principle: "The bull market nourishes the bull market". In other words, trends tend to strengthen themselves. At some point, however, the first investors begin to bid farewell to this trend and sell their shares. Now a new cycle begins, but this time downwards.
The dilemma now lies in the fact that very few people are able to recognize a stock market trend at the very beginning. The behaviour of investors is generally the same for both private and institutional investors. The psychology of investors plays an important role in the development of stock market prices. Thus a prognosis of future prices becomes a hopeless undertaking, because the human psyche cannot be packed into a tangible formula. Besides the interests of the innumerable investors are too different, in order to be able to draw from it uniform conclusions. A suitable diagram for this you find also in the attached psychology special in the article ?at the high buy, at the low sell?
The typical investor error in this context is the neglect of the rule "let profits run and limit losses". The cause is a wrong reference point. Because the investor orients itself only at its entry or exit price. And this is precisely where the decisive point lies in trend following trading. In trend following, investors orient themselves to prices set by the market.
Actions of a trend follower using the example of an ideal-typical upward trend
In order to illustrate the decisive difference to the emotional investor, we now want to examine the approach of a trend trader using the example of an ideal uptrend. Take a look at the stylized chart of an uptrend in Figure 2. We start at point A. This is where a new trend begins. At this point, however, no one can know yet. A few investors are starting to invest in this market. Traders who try to hit the bottom of a market will often be wrong and have little success in the long run.
After the uptrend has already moved slightly away from the previous low to the upside, investors following the trend will also receive their entry signal, namely at point B. This is the result of crossing the price with the trend following indicator. In this case, this is a Moving Average (MA)*. From now on, the price of the MA is the only reference point for our trend-following investor. This is the decisive difference to an emotionally acting investor, who only has the purchase price as a reference point. As long as the prices of the investment object move above the trend following indicator, the buy signal remains active. At point C, the trend reaches its high point. At this point, however, no one can know that this will be the highest point of the uptrend. For the trend follower, the uptrend is not finished until point D. Because there the price falls below the MA.
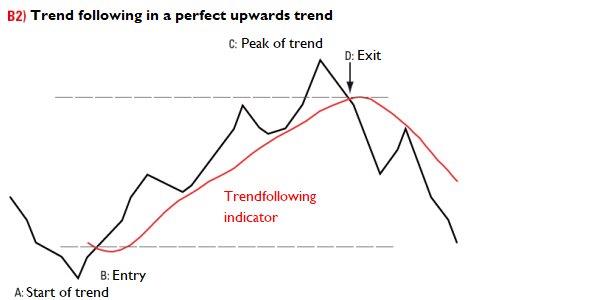
Image 2 (B2) shows a trend follower in the ideal-typical uptrend. The stylized chart of an ideal uptrend shows that trend follower always enter the market with a delay and only sell their positions after a top. As a rule of thumb, a trend can take about a third to a half.
We recognize that trend followers always invest in the direction of the overall trend. However, the buy or sell signals can never occur at the low or high points. These striking chart points are only recognizable as such after the fact. To put it casually: trend followers always enter the trend a little later and leave it a little later. This is due to the fact that trend following indicators only react with a certain delay due to their construction.
What initially sounds like a disadvantage turns out to be a decisive advantage on closer inspection. This is because the built-in delay ensures that, as a rule, investments are only made in established trends. This drastically reduces the number of false trades. Depending on the time horizon, trend following strategies will show the greatest success in long-term up and down trends. In sideways phases (sawtooth markets), on the other hand, false trades must be expected.
Trend following models have some special features. On the one hand, they are forecast-free because they follow a trend. On the other hand, they follow the old stock market wisdom of "letting profits run and limiting losses". At the same time, trend following strategies are highly transparent because they are bound by rules and their results can therefore be clearly determined in different market phases, both historically and on the basis of simulated markets.
Chance is involved
We saw at the beginning that trends as a result of a mass phenomenon depend very much on the psychology of the investors involved. Now we will show that the history of a trend can also be explained from a completely different perspective.
Image 3 shows a price trend for this purpose. It is noticeable that this chart looks deceptively similar to the price trend of a real financial market stock. In reality, however, the chart was generated on the basis of random prices. This is the famous "Random Walk", which is used in financial mathematics to model time series.
Image 3 (B3) shows a randomly generated artificial course. The chart shows a random walk with MA(200) (red) and MA(50) (yellow). With a strategy based on the MA(200) even in this random time series the pronounced long trends would have been "captured".
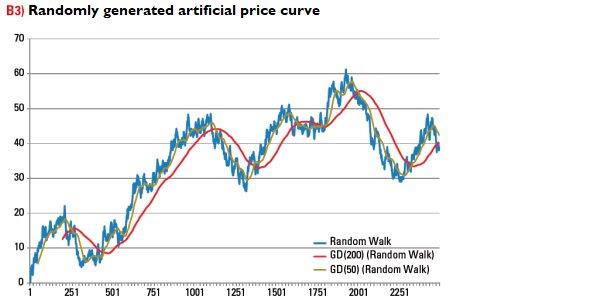
The astonishing result: Trends can also emerge by chance, without there being any logic behind them. The moving averages with the period lengths 50 (MA(50)) and 200 (MA(200)) show that these trends can remain very stable even over longer periods of time. Obviously we could have traded the chart shown - if it had been a stock - very profitably by simply investing as long as the price would have remained above the MA(200). The trick here is that we don't have to worry about fundamental interrelationships or company news or even logically link them. We simply accept that prices develop purely randomly. That is why technically oriented trend following traders never ask for the "why" of a price development. It is simply not relevant for analysis.
Moving averages to measure trends
There are numerous methods with which we can identify and measure trends. These include, for example, linear regression, Elliott wave analysis*, charting techniques and numerous technical indicators calculated on the basis of historical price data. In the following we would like to introduce the most important technique: Moving averages.
Share prices do not move up or down in a straight line. Rather, there are numerous daily developments that can rather be described as random fluctuations. Mathematicians and statisticians speak of "noise" here. The same principle also applies to a radio station. The essential signals - speech or music - are superimposed by interfering frequencies. This noise is suppressed with appropriate filters, so that at the end only the moderator or the song can be heard.
The same applies to filtering stock prices. With the formation of an average price, random fluctuations are suppressed and thus filtered out. What remains is a smoothed line that represents the trend of an index, a stock or any financial instrument. The longer the chosen time interval for the formation of the average price is, the smoother the resulting curve becomes. The daily change of a MA(200) is correspondingly small. This means that a MA(200) is quite slow. However, this characteristic is also desired, since then outliers hardly play a role with the consideration.
The application of the MA(200): Signals
We can now construct a contiguous line from the MA(200) values determined daily. The comparison with the current price of a security then signals whether the security in question is in an upward or downward trend. If the price is below the MA(200), we assume a prevailing downward trend. If the price line crosses the MA(200) upwards in the next phase, the underlying value changes into an upward trend. If the price crosses the MA(200), on the other hand, from top to bottom, the security changes from an upward to a downward trend.
Figure 4 (B4) shows a 200-day line using the example of Adidas.
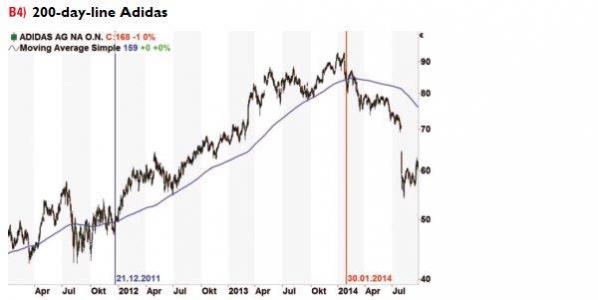
This is what trend following traders would like: At Adidas an entry would have been signaled on 21.12.2011 on the basis of the MA(200). Only on 30.01.2014 this share would have been sold with a saturated profit by falling below the 200-day line. In the meantime, Adidas was listed continuously above the MA(200).
Image 4 shows an example of the Adidas share, which has been on an upward trend for a particularly long time. Shown is the 3-year period from July 2011 to July 2014 and the MA(200) (blue line). We have marked the buy-signal from December 21, 2011 with a blue vertical. The price of Adidas was quoted just below 50 Euro at this time. Trend followers would have bought the stock at that time. Thereafter, Adidas rose continuously, whereby by the end of January 2014 - i.e. over a period of more than two years - the 200-day line was not breached once on a closing price basis.
Only on 30 January 2014 was the closing price below the MA(200). For trend followers this was the sign to the exit. In the chart we marked this day with a red vertical line. The share could then have been sold on 31 January 2014 at the opening price of approximately 83.50 euros. All in all, this trade would have resulted in a gain of around 67 percent within two years.
Advantages and disadvantages of the 200-day line
Using the example of Adidas, we have seen that signals based on the 200-day line can generate quite respectable profits without much effort. With long-term stable trends, this strategy is one of the best approaches ever.
However, there is a small catch: trend followers expect a further price trend in the direction of the new trend after a trend change. However, if a price crosses the trend line again very quickly, then there was a false signal from the point of view of the trend following. These can occur in longer sideways phases frequently one after the other, since then the prices constantly oscillate around the MA(200). Also using the example of Adidas, we have indicated such sideways phases for trend followers that may be very costly in Chart 5.
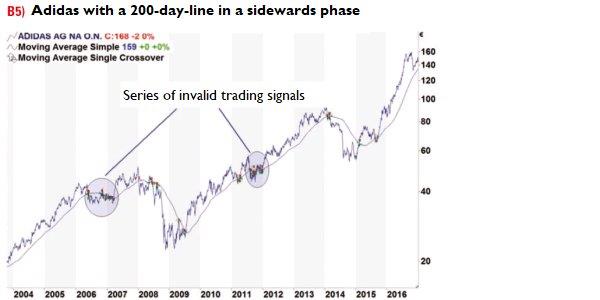
The adidas long-term chart clearly shows that frequent false signals can occur in sideways phases. Strict adherence to the trading rule, which is simply based on the 200-day line, can lead to substantial losses.
However, we can drastically reduce the disadvantages of these sideways phases with a small trick. The idea is as simple as it is ingenious: We put a band around the 200-day line and only act when the limits of this band are exceeded or fallen below. As a premium or discount to the MA(200) we choose a multiple of the average daily fluctuation range - also known as the Average True Range (ATR)*. Alternatively, a percentage distance to the 200-day line can also be selected. This should be between one and three percent.
MA(200) with safety band
Using the DAX as an example, we now show the differences between the conventional application of the 200-day line and the modified method with the aid of a safety band. In Figure 6, we first presented the DAX with MA(200) and all buy and sell signals for the period from 1995 to 2016. In the case of sell signals, only the long position was closed. We have not taken short positions into account. The development of the hypothetical capital curve (equity) can be seen below the price development. This is also shown in DAX points for better comparison.
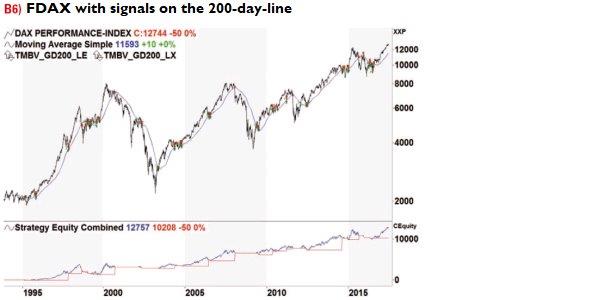
Image 6 (B6) shows the DAX chart with buy and sell signals and the 200-day line. Below the chart, the capital curve is drawn in DAX points (blue line), whereby the red line shows the sum of the closed trades. The performance of the trend following strategy is relatively constant due to the avoidance of high losses. However, the accumulation of loss trades in sideways phases can in some cases severely reduce performance.
As you can see: The really big trends are guaranteed to be caught with this method. However, success also costs something. Because in sideways phases numerous false signals are generated by frequent crossing of the MA(200). These are very small in amount, but add up in the course of time. Nevertheless, already this simple trading rule brings a clearly better result than a buy-and-hold strategy on the index.
For comparison, we have summarized some key figures in Table 1 (T1).
The table shows the most important key figures of a simple trend following strategy based on the MA(200) using the example of the DAX. The return is about one percentage point higher per year than for a buy-and-hold position. The hit rate of 35 percent indicates a rather average system. Nevertheless, the relatively high profit trades result in a high profit factor of over 3.
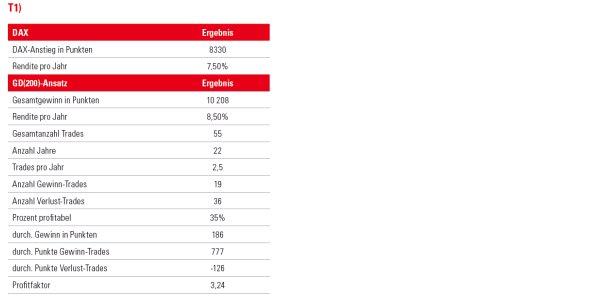
With a starting value of 2123 points, the DAX ended the period under review at 10 457 points - a net gain of 8330 points or the equivalent of 390 percent. On an annual basis, a return of 7.50 percent was achieved with a continuous investment in the DAX. Trend followers who follow the 200-day line would have achieved just under 2000 points more in the same period with 10,208 points. This is after all 100 percent more in relation to the starting value, even if the annual return of 8.50 percent is not quite as lavish. However, the compound interest effect should not be underestimated in this case.
In the next step, we have now varied this simple trading rule in such a way that we only receive a buy signal when the DAX has crossed the 200-day line with three times the ATR. The position was only closed again after the DAX had fallen below the 200-day line with the double ATR. Here, too, only long positions were taken into account. The trading signals and the development of the capital curve are shown in Image 7.
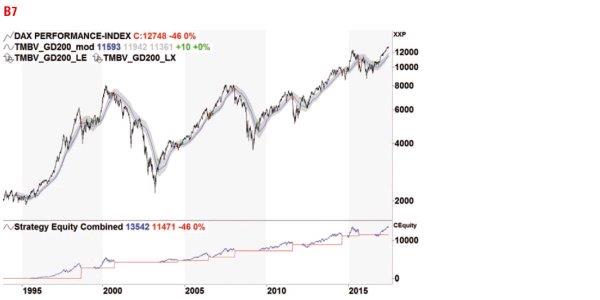
Source: www.tradesignalonline.com
The picture clearly shows that a safety band is again laid around the 200-day line in the modified approach. We receive a buy signal when the DAX has crossed the 200-day line with the triple ATR. The position is closed after the DAX falls below the 200-day line with the double ATR. This significantly reduces the number of false trades in sideways phases.
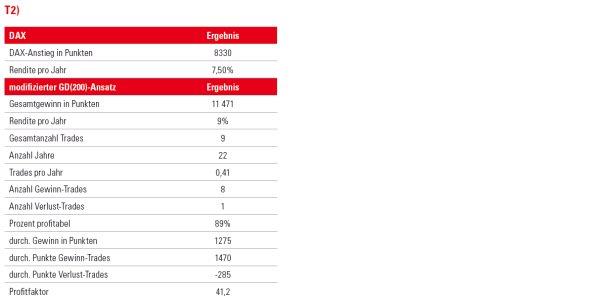
We see that the number of trades has decreased significantly. At 11,472 DAX points, the result was again significantly better. To this end, we have summarized the relevant key figures in Table 2 (T2). The number of trades fell considerably from 55 to nine. Of these nine trades, eight were concluded at a profit, with the overall gain in trend following strategy again being more than 1000 points higher. Over time, this results in a return of nine percent per year with little effort.
The modification has significantly improved our result.
Source: www.tradesignalonline.com
At the end of Tables 1 and 2 we have listed the profit factor. Roughly speaking, the profit factor indicates how many units of profit we make per unit of loss. The value of 3.24 for the "normal" MA(200) approach on the DAX shows that an average of 3.24 points could be earned per loss point. This figure increases to an astonishing 41.2 points with the modified approach. This brings us to what is probably the most important point in trend following trading based on the 200-day line: significantly reduced risk.
Keeping losses low and running profits
The rule-based approach significantly reduces risk. In a further chart, we have compared the capital curve of the modified MA(200) approach with safety band with the DAX (Fig. 8).
Image 8 (B 8) shows the capital curve Buy and Hold versus modified MA(200) approach
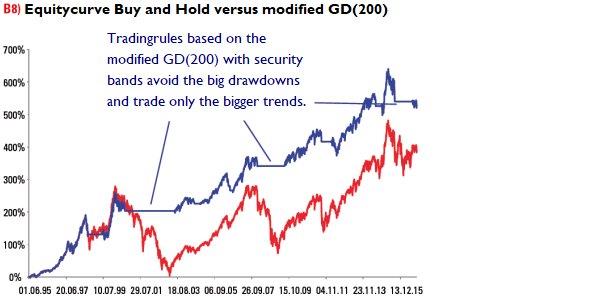
Source: own graphic of the author
When comparing (B 8) the capital curves of a buy-and-hold strategy (red) and the trend following approach described, it becomes clear that the advantage of the systematic approach lies in avoiding high losses. In strong trend phases, the system will generally perform somewhat worse than the market itself.
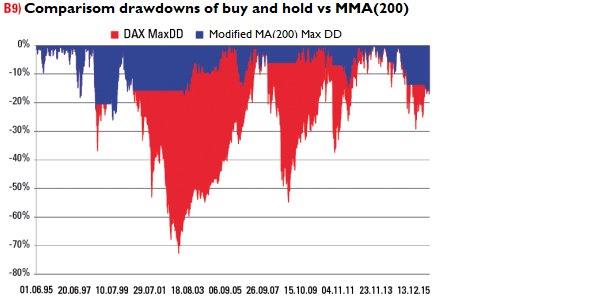
In chart B 9 we have compared the loss phases of a buy-and-hold strategy (red) with the loss phases of the modified MA(200) strategy (blue). Especially in the massive bear market phases, the losses are cut off early in the trend following approach and a re-entry usually takes place at significantly lower prices.
One major advantage of the strategy immediately catches the eye: trend followers are not invested in phases of major corrections and view events from the sidelines.
The horizontal lines in the system equity show that the system was not invested in these downward trends. This is the fundamental secret of successful investing. The chart does not even show that the liquidity released can be used for other, more profitable investments. In phases of strong DAX rises, however, the system cannot beat the index without the use of a lever. Most fund managers also lag behind the index performance in these bullish phases. Spectacular long-term gains can only be achieved if enormous losses are avoided. This is achieved by keeping the investment capital in the major trends for as long as possible. By contrast, the rapid closing of loss-making positions frees up capital for more profitable investment opportunities.
Bottom line
A rule-based trend-following strategy is able to achieve higher profits with reduced risk at the same time. We have shown this using a simple, basic example that can be further extended for practical use. Higher returns with lower risk are the key reason why trend following is the most commonly used strategy when using technical trading approaches. By staying away from those markets that are in long-term downtrends, released capital can be invested in other profitable financial instruments for additional returns."
Courtesy of TRADERS´: www.traders-mag.com