
New developments for traders are rarely found anymore. Everything was already there and was warmed up in one way or another - only in a new guise. An exception in the area of chart types are the so-called "Rangebars", which find their application especially in the intraday area. We would like to present the concept in this article.
Imagine you are sitting as a daytrader in front of your screens and both the volume and the range of fluctuation decrease significantly. You trade on the 15-minute chart and draw your lines. In such an environment, one bar follows the other without doing anything. Maybe it's lunchtime and everyone is at the table, or you want to wait for the release of supposedly important numbers. An existing trend is broken, the corresponding breakout is traded despite the lack of momentum. The environment remains the same, no energy is generated. Last but not least, the position is also stopped by a random order.
This is where the range bars come in, which are also known as momentum bars, spread charts or breakout bars. The principle behind this is comparable to the Point&Figure representation: A new candle or a new bar is only created when the price changes beyond a certain size, the time is completely disregarded. In the above mentioned candle chart, the candle ends automatically after 15 minutes, the egg timer of the following candle then begins to count backwards again. Whether there are one, ten or 100 courses in this time unit is irrelevant. The range can be small in night trading and large in the afternoon at the opening of Wall Street.
What are Rangebars?
Rangebars are an invention from Brazil. The trader and broker Vicente Nicolettis traded the domestic indices and faced the problem of volatile markets, which calmed down first and then became more volatile again. He thought he had to avoid this motionless trade and developed the technique presented below. Rangebars can be displayed as bars, but also as candles, and analyzed according to the usual chart rules.
Before a chart is created for analysis, the range for the necessary calculation must be set. This setting is made in ticks, the smallest possible movement. Let's take the DAX future with a tick size of half a point as an example. If you set a range of 30 ticks, a candle/bar remains valid until the future breaks out of the current rangebar range of 15 whole points.
Picture 1 Comparison Intraday-Chart and Range-Chart

Picture 1 shows a 15-minute chart on the left and a rangebar chart of the DAX future June 2012 contract on the right. The setting for a Rangebar is 30 ticks. Trend lines on the right side can be applied much more precisely to the price trend and show trend break signals than the "normal" chart.
Picture 1 shows the comparison of a 15-minute chart (left) with the rangebar calculation (right). While 13 candles are counted in the normal intraday chart, there are 26 candles on the right side of the rangebar chart. Left in the picture you see a large upward candle, which is shown on the right as four candles with 30 ticks each. At the top in both charts there is a candle and the newly formed downward trend shows itself again in only one candle on the left side, while on the right side you can count six of them. This already shows the first advantage of this new display mode: Trends are easier to recognize and stops can be placed more precisely.
Rangebars always have the same length
Another difference compared to the left candlestick chart is that in the rangebar chart each candle has the same length. As long as the candlestick is not yet formed and there is a breakout upwards or downwards, the chart remains unchanged. A rangebar is therefore only replaced by a new bar when the set tick size is exceeded. While other articles on this subject always assume that a rangebar only opens and closes at a high or low, we notice that it can also lead to the formation of a fuse or wick. These can often be found in hectic phases when a gap is formed between one trade and the next.
Are you looking for an outstanding futures and CFD-Forex broker?
In the annual Brokerwahl traders voted WH SelfInvest as "Nr. 1 Futures Broker" and "Nr. 2 CFD Broker". For an incredible five times in six years WH SelfInvest is considered the best futures broker, beating all competitors by a wide margin. In CFDs WHSelfInvest came only 0,1 behind this year's first-placed broker. Clients are extremely satisfied with the low commissions, outstanding order execution and the legendary service.
Test WH SelfInvest, download a free demo.
Let us now turn to the main advantage of this method, which can pay off especially for short-term traders: Trend breaks are much faster and easier to detect than in "normal" candlestick charts. Let us stick to the example of the DAX future mentioned above. Figure 1 shows a trend line. While the right picture shows a trend break close to the top, the 15-minute chart on the left shows a trend break about 30 points lower; the same can be seen at the bottom. On the right, a counter-movement is already broken with an average of a possible downtrend line that could have been drawn, while on the left, one does not notice anything at all about this downtrend break. The second big advantage is the stop setting. On the 15 minute chart, the stop loss is set at a short position 50 pips above the trend break, on the right a stop above the 19 pip high is enough.
Table 1: Range Settings for Important Markets
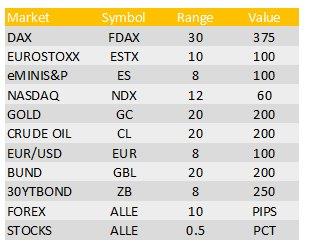
Table 1: Each market has its own attitude. In the table you will find the tick settings and the corresponding value of a range bar based on them in dollars or euros. For equities and forex pairs, global settings are listed in percent or pips.
Time is out of the question
Nicolettis, however, wanted something different in his development. At that time he had no idea that the chart technique could also be used successfully here. His main reason was to exclude trendless sideways markets. Low volatility should be reflected by fewer candles in the chart, while trend phases should generate more of it. Figure 2 shows vertical lines for time intervals of one hour each. For example, volatile phases are associated with a large number of Rangebars, in late trading after 20:00 hours often one candle per hour is sufficient.
While on the far left of the chart three candles represent the last three trading hours of the previous day, on the following day four rangebars were formed in the first trading hour of the futures from 08:00 to 09:00 hours. After the official stock market launch at 09:00 it became really volatile. This was the longest hour in the chart with twelve bars. Around noon the market calmed down again and promptly from 13:08, when many traders stuck to their screens again, the DAX future broke out. In such phases, gaps are filled with so-called "phantom candles". These are a conflict of interest for the trader; they cannot be traded because there is no price in this area. Studies from America show, however, that signal generation can be accelerated by these artificial objects. Users of the range charts can find out for each specific market when it is worth sitting in front of a PC and when it is not by checking past days and weeks. The prerequisite, however, is that the correct setting of the examined object is made first.
Picture 2: Different volatility in the chart clearly recognizable

The main advantage of the Rangebars is that nothing new arises in the chart the longer the price stays within the limits of the corresponding Rangebars. Picture 2 shows the individual hours with the corresponding rangebars.

Each market has its own range
Futures have different tick sizes. One tick in the DAX future corresponds to 0.50 points, while one point in the EURO STOXX future and 0.01 points in the Crude Oil (CL) future. Table 1 shows the values that should be used to set a reasonable stop when using range charts. Shorter ranges are also possible, but this is not recommended in fast markets. You may find good entry points afterwards, but since each rangebar is only traded in seconds before a new one is created, manual entry is difficult and involves high slippage.
Use of indicators
The big question for traders is whether they can also use the known and less known indicators on this chart. There is nothing against it. Historical observations of automatic trading tactics, however, should be treated with caution as markets are constantly changing.
In Figure 3 the Momentum indicator* with a period of 13 and a Moving Average (GD) with a period of 28 have been added. This system gives signals as soon as the indicator crosses the GD. Sell signals are generated when crossing from top to bottom, vice versa for buy signals. The indicator itself must be above the zero line for short recommendations. Conversely, this applies to longs: the indicator is above the zero line.
The corresponding signal arrows are entered in the price trend. It can be seen that in sideways phases there are often false signals, as is the case with other indicators. Only a combination of chart analysis, sales and additional advisors leads to the goal.
Picture 3: Rangebars can also be used with indicators

Picture 3: The chart of the DAX future shows the signals using a short-term momentum indicator.
Cornerstones of the Range Display
Let us summarize once again the characteristics of the Rangebars presented here:
- Each bar/candle/bar has the same size, because the corresponding setting defines it.
- The closing price is always on or near the high or low.
- The opening price is always outside the range of the previous bar.
- The time period varies from hours (low fluctuation times) to seconds (fast markets).
- Gaps are filled with phantom candles.
Data providers
Unfortunately, this chart does not have a uniform name in the different analysis programs: Some use the name Momentum-Bars, others call this chart form Spannenchart. The charts shown here were created with Track 'n Trade Realtime. Here is a list of some providers who offer corresponding evaluation options: Nanotrader, NinjaTrader, TradeStation etc.
All of them are active in the futures market and you can create charts without any problems.
Summary
If you are travelling in the markets on a short-term basis, you should definitely take a closer look at this creation from Brazil. This chart is especially useful for swing trading during a trading day. However, anyone who relies on automatic trading systems should be warned: Joachim Lenz, a physicist from Giessen, Germany, who supervises the trading systems department of VTAD-Frankfurt, has informed us "that the constantly changing dynamics of the markets make it extremely difficult to create charts on rangebar systems that deliver consistently good results". The discretionary trader, on the other hand, has the rangebars as an extension of his arsenal with which he can set his stops narrower than is possible in normal intraday charts. This alone makes it worthwhile for him to take a closer look at this chart.
