
Renko is a simplifying and optically very clear presentation form for price data. Renko has many advantages for the development of trading systems. Patterns, chart technical aspects and trends are easy to describe and offer little room for interpretation.
Renko can also be used wonderfully in a trading system for trading stocks and, above all, for following trends. This article describes the advantages of the Renko charts and a trading system for trading stocks and stock portfolios of a trend-following nature. The trading system detects trends in the price data, waits for consolidation and then trades the continuation of the trend.
Basics of the Renko Charts
In order to provide all readers with a comprehensive information stand, the basics of the Renko Charts will be discussed once again here. This is followed by information on the most important calculations that form the basis of the trading system and on the system rules themselves.
Renko charts simplify the presentation of price data by dividing the changes into equal sections (bricks). Since each brick is assigned the same height, time loses its central role in this representation. Renko charts do not have a linear time axis. If the market moves around the given brick height, a new brick can be drawn. If the price from the last brick has risen by a full brick height above the height of the previous brick, a new brick in blue color is drawn above it. If the price falls by a full brick height below the depth of the last brick, a new red brick is drawn. The colors can also vary with some charting programs.
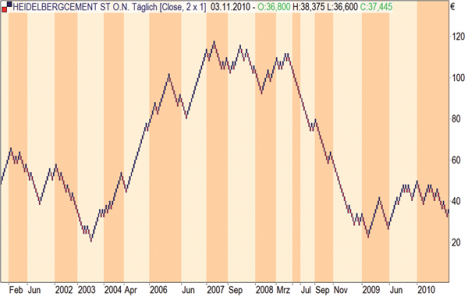
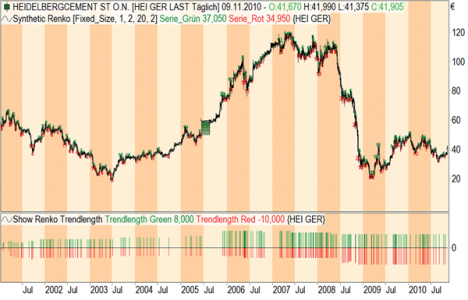
Image 1. A conventional Renko chart showing Heidelberg Cement. The irregular grid clearly shows how long the market needs for the price development, since a Renko brick has a defined price range and therefore no defined time unit.

The most important effect achieved by the Renko charts is the clear presentation of the price trend. If you place a Moving Average on a normal bar or candle chart, the definition of the trend is also possible, but offers a number of unnecessary interpretation possibilities due to unclear situations. In addition to determining trends, it is also much easier to describe formations and chart technical aspects, as the underlying brick grid forms a clear basis for this.
Renko in trading systems
Almost every software that can be used to develop trading systems also offers various options for displaying price data. Renko is a standard chart almost everywhere. You will often notice that an average trading system on the Renko chart suddenly mutates into a golden calf. There are several reasons for this, which can be traced back to a lack of clarity in the calculation of the system rules on the one hand and an incorrect calculation of indicators in the Renko chart on the other. The software packages that have been on the market the longest have the least problems and deliver the most reliable results.
Download free e-books ...


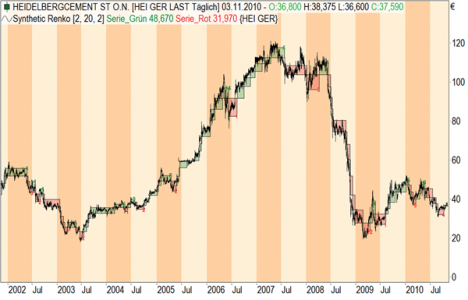
Tradesignal also offers Renko-Charts as a form of presentation and you can easily and comfortably calculate indicators and trading systems with them. Also the calculation of the performance report and all statistics is reliable. Nevertheless, I personally consider the pure Renko representation to be insufficient for the development process. In order to avoid the problems mentioned above and to keep control of the trading system activity in my own hands, I decided to develop my own solution for the Renko representation. This solution draws Renko bricks in a bar or candle chart and thus allows the possibility of controlling the trading activity precisely to the point. The basic program provides the most important information on the current brick and also provides information on all bricks drawn so far. For example, it can be determined with minimal effort how many bricks were in the last series, what color these bricks were and where the start and end points of the respective movements were. Figure 2 shows the overlay of a candle chart with the synthetic Renko representation. The red and green numbers indicate the respective series length. The program routines for calculating and displaying the synthetic Renko bricks are included in the trading system. In addition, you can also download a single indicator, which takes over this task.
Image 2. Superimposed candle chart. Image 2 shows the marriage between candle chart and Renko bricks. This solution offers optimal conditions for the development of trading systems and for the control of trading activity.
Construction kit for developers
The development of trading systems consists of the search for entry possibilities into the market to be traded and the formulation of meaningful rules for the management of positions taken. The formulated rules should prove to be profitable over as long a period as possible and be insensitive to minor changes in calculation periods or other variable parameters of the system. Renko simplifies the definition of the entry rules clearly, because the developer receives a construction kit from equally large elements, the bricks, with which he can describe patterns, chart technical connections and trends very simply. The presented hybrid solution of Renko representation and bar chart also allows the precise determination of stop loss and target marks and enables the exact calculation of quantities for the positions.
Perhaps the most important aspect of this hermaphroditic solution is the optimal determination of the brick height, since the normal bar chart is visible in the background of the Renko brick and thus a direct comparison to the actual price data is possible. Two simple information categories are now available to the developer with series lengths and colors, with which even complex patterns can be easily described. In addition, a very good trend definition can be worked out over the series length of the individual market movements.
Differences between stock trading and the single market system
Today, the presented system should deliver good results on the basis of daily data and as many shares as possible. This results in the great difficulty of finding a generally valid and meaningful definition of the brick height, which can be automatically implemented in the system for the various stocks. If you look at Fig. 3, you will notice that the two shares HeidelbergCement and Infineon have very different price values.
Image 3: Different brick heights for shares. In order to be able to compare the results of the trading system and to have equal conditions across all stocks, it is necessary to adjust the brick height to the price level. In the upper chart of Heidelberg Cement, the brick height was set to one euro, at Infineon to 20 cents below.
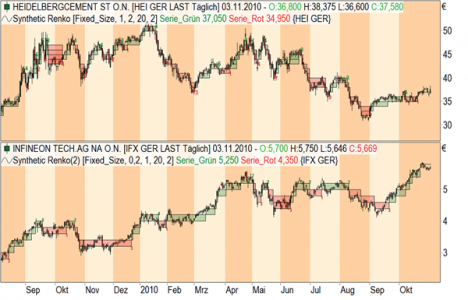
This results in significantly different brick heights for the Renko representation. For the upper chart of Heidelberg Cement, one euro was chosen as the brick height, for Infineon it is only 20 cents. To ensure that the rules of the trading system can always be executed correctly and sensibly, the structure of the Renko bricks must be the same everywhere. In order to achieve this, the manual specification of a fixed amount for the brick height is dispensed with. Instead, the volatility of the underlying is measured and used as the unit for the brick height. In this case, the average bar span, measured over several days, is called volatility. Price gaps between individual days are not taken into account in this form of volatility calculation. The brick height is now given as a multiple or a fraction of the volatility. Specifically, the presented system uses a factor of 0.5. This creates the basis for the trading system to be processed correctly, regardless of the underlying security, and for the results of different stocks to be compared with each other.
This procedure is particularly useful if you use the trading system in Tradesignal's scanner for larger baskets of stocks or if you use Tradesignal Standard's portfolio module. Trend determination with Renko The last article on Renko charts and trading systems showed how easy the term "trend" can be described using Renko. It should be noted that in this context, trends are not described as overarching years of movement, but rather as shorter sections of market movement that run uninterrupted. For a rough and long-term assessment of the direction of movement, a moving average of the closing prices of the bricks is looked at. Otherwise, no indicators are used at all. The system calculates the standard deviation separately for red and green series.
Broker WH SelfInvest receives another outstanding rating from the German consumer institute.
- Order execution: 5 out of 5 stars. Score: "extremely good".
- Trading platform: 5 out of 5 stars. Score: "extremely good".
- Mobile platforms: 5 out of 5 stars. Score: "extremely good".
- Service quality: 5 out of 5 stars. Score: "extremely good".
- Order possibilities: 5 out of 5 stars. Score: "extremely good".
Test WH SelfInvest: free demo trading account.
This key figure is a measure of the uniformity of the distribution of data around its mean value. In our case, the double standard deviation of the series lengths tells us how many bricks the longer third of all series comprises. Of course, this calculation is as inaccurate as any other trend definition. However, it is self-adjusting and can be used without changes for any underlying value, regardless of whether it is quoted at 100 or one euro. The trend length determined separately for red and green series indicates the number of bricks from which a trend movement can be assumed, and that all series that are one third shorter are to be regarded as consolidation. Image 4 shows a graphical representation of this evaluation. The red and green bars of the indicator below the chart show the current trend length. It can be seen that these values are subject to changes over long periods of time. The indicator for these calculations can also be downloaded.
Image 4. Calculation of the trend length in the Renko chart. Image 4 shows the evaluation of the series lengths. The automatic evaluation determines how many bricks a series must contain in order to be considered a trend movement. You can easily see that this evaluation leads to fluctuating results.
Consolidation after a trend
The trading system should trade outbreaks after a consolidation. For this it is necessary to describe this market phase and to recognize it reliably. Every developer knows how difficult it is to describe certain market phases in the program in such a way that they are recognized as often and reliably as possible and without many false signals. Renko makes this task easier. A perfect solution, which always works and hits 100 percent sure, will not exist here either. Consolidation is generally defined as the easing of a strong trend movement and a slight correction. Consolidation phases are characterized by decreasing volatility and decreasing turnover.
For our trend following system it is sufficient to describe the consolidation very simply. If the system has recognized a trend, i.e. a series of bricks that are equal to or longer than the determined minimum length, their final value is stored on the price scale. The start value is regarded as the error level, the breakthrough of which invalidates the setup. A number of subsequent series no longer than 75 percent of the applicable minimum trend length measured in bricks complete the setup.
The Trading Rules
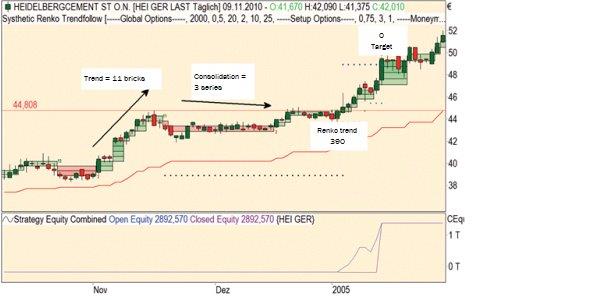
Now that you have familiarized yourself with the individual blocks, it is time to assemble the set of rules. The setup starts with a series that meets the trend criterion, for example at least eight bricks. If the series is green, the high of the last brick is considered the breakout level, to which a buffer of one to two brick heights is added. The low of the first brick of this series is considered the error level. Now the system waits for some smaller series with a maximum length of 75 percent of the trend criterion. If a longer series occurs, the setup is aborted. If the market passes through the entry level before the required number of consolidation series have expired, the setup is also aborted. If the market has created the required consolidation series and then runs through the entry level, the system enters a position if the higher-level determination of the market direction allows this. A 50-period average of the brick closing prices is calculated, which corresponds to a long-term moving average of the bar periods of 100 or 200 periods. Figure 5 shows the chart of Heidelberg Cement with trading system and profit curve. The position size is determined on the basis of the available capital and the initial risk. One percent of the account is divided by the initial risk into cents or euros. This results in the number of shares to be traded.
Image 5: The trading system in Heidelberg Cement's chart. The figure shows an introduction to the complete set of rules. A trend with eleven green bricks is followed by three smaller series, which are considerably shorter. The entry into the trend continuation takes place one brick above the high of the initial series.
Position management
Once the system has taken a position, stop loss, price target, trailing stop and break even stop are activated. The last three components can be switched off if desired. The stop loss is placed under the low or over the high of the active brick. The distance is indicated in brick heights. The price target is also indicated in brick heights. The trailing stop is activated after the market has formed two bricks above/below the entry price. The break even stop is also activated as soon as the market has formed one or two bricks above/below the entry price. All settings are variable.
The trading results
The system can be traded in individual charts or on stock baskets. The second variant is much more convenient for testing on stock baskets and offers better comparison options.
For the test run, the DAX30 shares were tested in a scanner. The system waits for three consolidation series and enters the market one brick above/below the entry level. Long is traded if the respective underlying is above its long-term average, short only if it is below it. The stop loss is two bricks away from the entry. After two bricks in the positioning direction, the stop loss is adjusted and tracked with each additional brick. The target of the position is indicated with ten brick heights. The test period is 2500 days. The setup provides relatively few signals. The number is between five and twelve signals per share. The results are clearly positive. With ten Euro half-turn costs realistic trading costs are included. 17 of the 30 DAX stocks show positive results. The percentage success rate of the positions is between 40 and 70, on average over 50 percent. The ratio between profit and loss over all shares is 2.5.
Conclusion
Renko is the perfect basis for defining trading rules. The presented trading system can be described with a few lines of source code after the calculation of all basic data. The trend following system is profitable and makes good profits at low trading frequency.
