
Triangles are among the most recurring patterns in trading. Here are the basics and some guidelines on how to trade them more reliably.
The goal of every trader is to identify patterns in the markets that make promising trades likely, regardless of the technique pursued. Chart formations are useful trading tools in this context as they represent the mass psychology that repeats itself in the markets. Market participants tend to respond to external influences in an easily predictable way. This applies both to the publication of corporate results or interest rate decisions by central banks, as well as to homemade effects such as breaking through an important resistance or support line of a market or stock.
All this now triggers reactions among traders and investors who repeat themselves over and over again in the market. These activities are reflected in formations that can be seen in chart movements such as triangles. Traders can take advantage of this as they emerge from a series of predictable actions and reactions.
Triangle types
The triangle is a chart formation that takes its name from the converging trend lines. There are three typical types of triangles: symmetrical, rising and falling (Figure 1).
Picture 1: Triangle variations
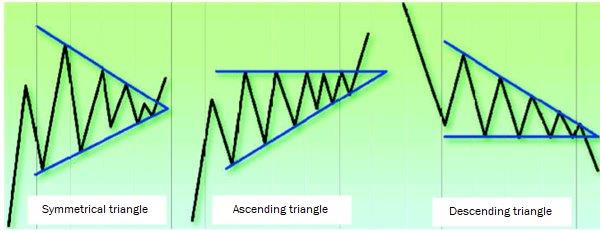
There are three typical triangular formations: symmetrical, rising and falling. All triangles have one thing in common: they represent a consolidation.
A symmetrical triangle resembles a flag bordered by a downward and an upward trend line. It occurs when the buyers are no longer strong enough to make higher highs and the sellers no longer have deeper lows. The result is an ever tighter trading range, accompanied by declining sales. A rising triangle is bounded by a horizontal trend line up and a rising trend line down. A falling triangle is the exact opposite. The symmetric triangle is the most common variant, but all types appear again and again. This has its advantages and disadvantages. On the positive side it may seem that there are frequent trade setups, on the negative side it is that this frequency also ends in a larger number of loss trades. As Figure 1 shows, triangles stand for sideways movement or consolidation. Prices are moving back and forth in an increasingly narrow range. Until a sufficiently high "pressure" has built up that leads to a breakout from the formation.
The characters of the triangles
In an uptrend, buyers are more aggressive than sellers, creating demand so high that prices rise. A triangle emerges when this situation changes. If the market pauses by failing to make higher highs and higher lows, the impression is obvious that buyer and seller have found a balance. This is shown in the chart as a sideways trend in price movements (a consolidation) that may show up in some formations, including triangles and rectangles. Triangles can occur within trends or at reversal points. The former are also called continuation formations, which means a break in the existing trend and suggests that the trend will continue when prices break out of the triangle. The latter are referred to as reversal formations that mark significant tops or bottoms of long-term trends. Typically, triangles are continuation patterns.
To define a triangle regardless of its type, the trend line should consist of at least five points (see Figure 2). Triangles can form in any time frame and are easiest to identify on daily or intraday charts.
Picture 2: The symmetrical triangle

The symmetric triangle is the most common type of triangle. The best breakouts occur at a distance of 50 to 66 percent of the distance between the start of the triangle and the vanishing point of the trend lines.
They are best traded in the short term, as it is then less likely that they will be interrupted or distorted by long-term external effects such as central bank policy. In some sources, triangles are only considered valid if they took less than three months to complete in the daily chart. Regardless of the time frame, the breakout should happen before the prices have crossed two thirds of the triangle, i.e. two thirds of the way before the converging lines meet at the peak. Sometimes it is worth trading breakouts that already occur in half of the formation. However, the reliability drops beyond the two-thirds limit. With late outbreaks near the top, it is highly unlikely that a profitable trade will come. The best way to unmask outbreaks is to look at volume. A breakout that occurs with increasing volume is more reliable (which applies to all chart formations). On the other hand, the volume should decrease during formation development. This implies that market participants are indecisive and retreat to the sidelines.
Trading example picture 3 shows a symmetrical triangle. The price has broken upwards, making it a continuation formation. The best way to trade this constellation is to enter the market as soon as it breaks out, the trend continues as before. The intraday chart in Figure 4 shows us volume characteristics of a triangular formation. The volume fell as long as the triangle was developing and jumped as prices went through the upper boundary of the formation. Traders responded to the price movement and were interested in the stock.
Picture 3: The triangle as a continuation formation


A symmetrical triangle erupts upwards. In this case, the market continues to move in the direction it had previously chosen. The triangle becomes a continuation formation.

A falling triangle forms in the upward-trend of an intraday chart. Noteworthy is both the decreasing turnover as the triangle develops and the increase in turnover as the price breaks out of the formation.
Picture 5: Price projections

The maximum range of the triangle can be used to estimate a price target. The difference between A and B is added to the breakout level (C) to obtain a price projection. In this case, the stock paused when it reached the price target before it exceeded it by a few points and then consolidated.
Price targets
Price targets can be derived from the range of the triangles, which is always set from the left side of the triangle. The price target corresponds to the maximum spread projected up or down at the breakout point. Even if you do not become aware of a breakout in the chart until after it has happened, but you have crossed a range that is still smaller than the maximum width of the triangle, it is still not too late to trade.
Bulkowski analyzed the probability of various triangles to reach their price target. He found out that more than half of the successful trades reached the target. Symmetric and rising triangles within uptrends had the highest probability of reaching the target. This favors triangles where prices break in the direction of the trend. These are continuation formations.
In the rising triangle of chart five, we calculated the price target by drawing the difference between points A and B ($4) and adding it to the breakout level (point C). The resulting price target of $52 was reached and exceeded.
You can search a long time until you find a system that can identify the triangular formations shown here. It takes a lot of time and effort to find the prerequisites. Note: You should always keep a close eye on the sector indices. For example, if the retail index is in a trend and consolidation begins, you should consult the charts of the individual stocks it contains. Most likely, some of the leading stocks will turn into consolidations that show themselves as triangles.
