Everyone wants to know how prices will develop tomorrow and the day after tomorrow. This is a difficult task because stock prices are subject to constant change. Even the best trained financial experts have a hard time doing this. In addition, many emotions come into play, which certainly does not make the situation any easier. Technical analysis is a very good way of looking at the markets from a distance, without emotions putting a spoke in the wheel.
The advantages of technical analysis:
- Transparent rules allow an objective evaluation of the share price development.
- Rational decisions suppress emotional mistakes.
- Clear criteria enable repeatability and thus certainty.
- Very well suited for assessment in short-term trading.
But what is technical analysis?
Technical analysis is the investigation of historical price movements and their transformation into a forecast of future price movements. Technical analysis can therefore not accurately predict prices. Technical analysis does not interfere with the financial data and background of companies, i.e. the area of fundamental analysis. Technical analysis assumes that all information flows into prices. A cornerstone of technical analysis is the assumption that prices move in the trend direction and that the past repeats itself. Technical analysis is mainly used in exchange trading for short-term trading. Technical analysis is not a holy grail and certainly not infallible. For the short-term investor, however, fundamental analysis offers no solution. In general, fundamental analysis proves to be valuable in the long term, while technical analysis makes more sense in the short term.
A forecast made with the help of technical analysis does not always occur. A success rate of sixty percent is quite good. If a forecast is not successful, the position must be closed using a given scenario, e.g. a stop loss. Equally important is a clear scenario for profit taking. Moreover, technical analysis is not the whole success story for an active investor. Equally important is disciplined execution and money management.
Technical analysis consists of two disciplines: visual analysis and statistical analysis. In this practical guide, we are mainly concerned with the second method.
Visual analysis
Technical analysis often uses graphs, also known as charts, from which the phrase "read chart" is derived. A graph or chart is clear and shows the status of things at a particular point in time at a glance. Graphs can be created in various ways, but a bar chart or line chart is usually used. The visual analysis is the domain of trend lines, price patterns, head and shoulder formations, etc. The user seeks to discover clear patterns and trends. Nevertheless, there is inevitably a subjective component to visual analysis. One analyst will sometimes recognize a certain pattern, the other not.
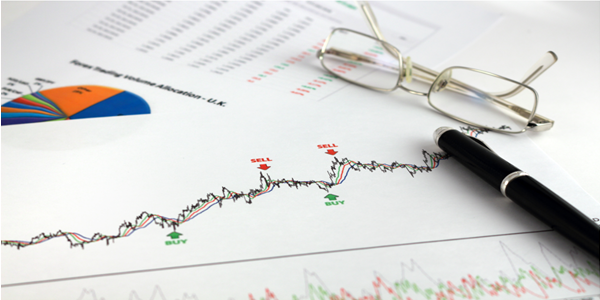
This example is intended to illustrate the visual analysis.
Statistical evaluation
Statistical analysis is the domain of indicators and trading systems. Indicators are an arithmetic derivation of the chart. With the help of mathematical formulas, we try to gain more insight into the behaviour of historical price movements and thus develop a vision of future price developments. Statistical analysis is objective. The calculations performed can only be explained in one way. This can eliminate human emotions, which are often the cause of inconsistent and irrational stock market behaviour. The indicators are available in all forms and sizes. Some perform well in a trend market, while others perform well in a sideways market (trading market). If an indicator can objectively indicate the buying and selling points in the market, we also speak of a trading system.
This example shows a complete trading system in the NanoTrader trading platform with objective buy and sell signals based on the Bollinger Bands indicator in a 30 minute chart. Green arrows are buy signals, red arrows are sell signals.
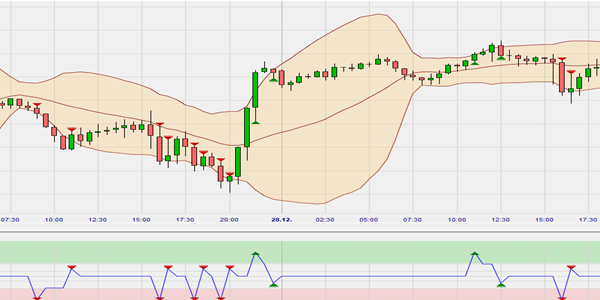
Look for yourself and request a free demo of the NanoTrader trading platform.
The search for the most powerful settings of an indicator for a particular market or stock is called optimising an indicator. The calculation of what a certain indicator would have achieved at the points of sale and points of purchase found on the basis of historical prices is called backtesting. The so-called trend following indicators perform well in a trend market, the oscillators in theory perform better in a trading market. In order to determine whether a market has a sideways or trend, special indicators, the so-called trend indicators, have been newly developed.
Trends in volatile markets
The following figures (1-3) clearly show whether it is a trend market or a trading market (sideways market). Unfortunately, it is not always completely clear whether it is a trend market or a trading market. Sometimes the trend is obscured by sharp price movements in the market. The more volatile the market, the more difficult it often becomes to determine the trend.
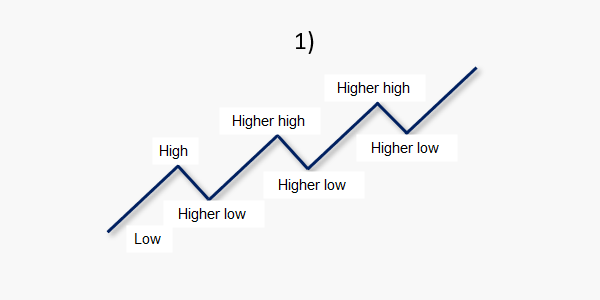
This example shows an upward trend through ever newer and higher highs.
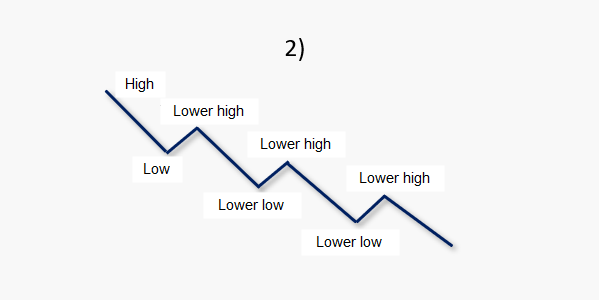
This example shows a downward trend through ever deeper lows.
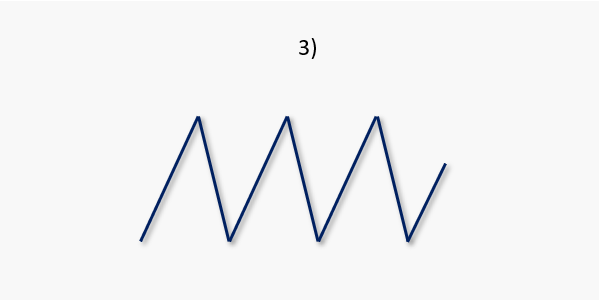
This example shows a sideways trend due to a lack of higher highs or lower lows.
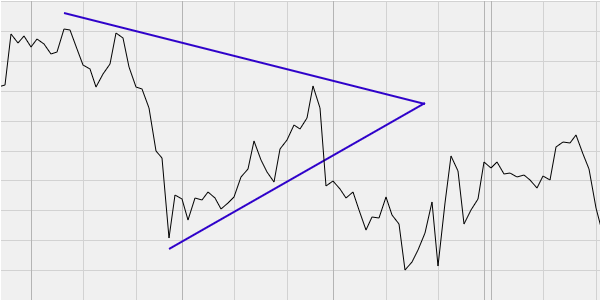
The figures below illustrate the difference between a line chart and a bar chart. A correct representation of support and resistance lines is only possible with a bar chart. The figures combine both support and resistance lines in a so-called triangle pattern. (The creation of a triangle usually means the emergence of an important price movement.)
This example illustrates a line chart based on 60 minutes in the NanoTrader platform.
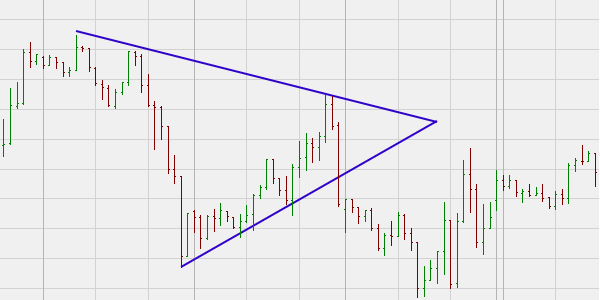
This example illustrates a bar chart based on 60 minutes in the NanoTrader platform.
Try to detect some of these chart patterns yourself. Get a free trial version of a powerful trading platform here.
Time frames
Every investor has his own investment horizon. A very short-term trader, a so-called scalper, thinks in seconds or minutes, a day trader in intervals of 15 minutes or hours and a position trader in days or weeks. A longer-term investor thinks in months or years. So every investor has a certain time horizon for his trades in mind. This means that he also carries out his analyses in related time units. A day trader uses his analyses e.g. on candles of 5 minutes and a position trader on candles of daily prices. This only refers to the time horizon. However, the technique of visual and statistical technical analysis can be applied to any time frame.
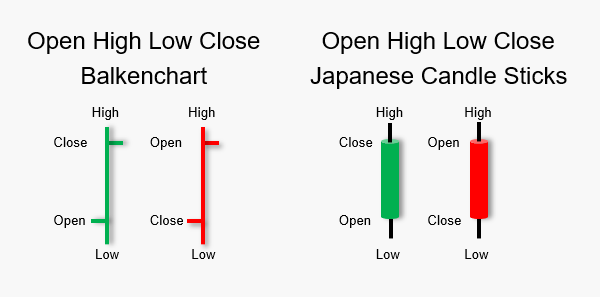
These examples show open, high, low, close (OHLC) of bar charts and Japanese candle sticks.
Analyse different time frames
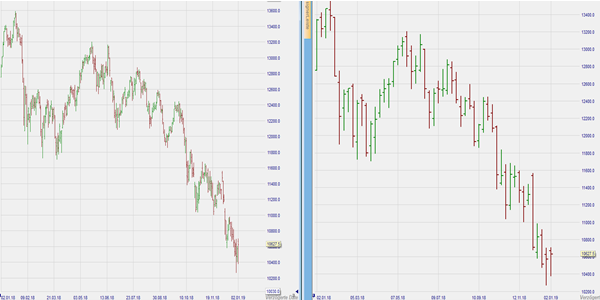
Different traders can analyse and trade in different time frames. However, a single trader will also look at the superior time frames. A day trader will also often look at the longer-term trend on a daily and weekly basis to prevent, for example, trading against the trend. There are also trading methods that use one or more indicators simultaneously in different time frames and only trade when the indicator signals from different time frames confirm each other.
In this example, two bar charts are shown over the identical period of one year on the NanoTrader trading platform. On the left the daily chart and on the right the weekly chart.