The Bollinger Bands Indicator, named after its inventor John Bollinger, is one of the best-known volatility indicators. Bollinger Bands form a band around a Moving Average (MA). This band is calculated from the standard deviation of the prices, taken over the selected MA period, and multiplied by a band factor. John Bollinger advises using an MA period of 20, and a band factor of 2 for the calculation. According to the inventor himself, an MA period lower than 10 works less well. Because the bandwidth of the Bollinger Bands is dependent on the standard deviation, the bandwidth widens as the stock’s volatility increases, and the band narrows as prices stabilize and fluctuate less.
The Bollinger Bands can be interpreted as follows.
With a narrow band, there is a high probability of a breakout upwards or downwards.
- When prices break the band, this often signals a continuation of the current trend.
- A top or bottom outside the band, followed by a top or bottom within the band may suggest a trend reversal.
- A price development that begins at one of the two bands usually continues to the other band, which can be useful in determining price goals.

PARAMETERS
- MA Period
- MA type
- Band factor
BUY AND SELL SIGNALS
N/a
DIVERGENCE
N/a
INDICATOR TYPE
Volatility indicator
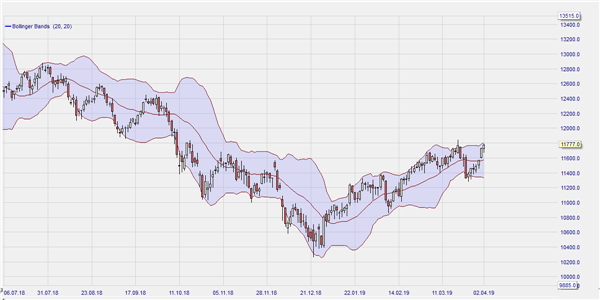
The following example shows how effective the Bollinger Bands are in indicating the relative volatility in the market. Here was see a daily chart on de FDAX. The tighter the range of the bands the less volatile the FDAX is. Volatile periods make the bands expand.