The Commodity Cycle Index (CCI) is a design from 1980 by Donald R. Lambert. Despite the word ‘commodity’ in the name, this indicator also lends itself well to stocks and indices.
The indicator was originally designed to predict reversal points in cyclical price-development patterns. A CCI value above the +100 line indicates an upward movement, with a value below the -100 line suggesting a downtrend.
Despite being an oscillator, the CCI really comes into its own in a sharply fluctuating trend market. The CCI is often adept at finding reversal points in various short, consecutive price rallies.
The CCI is also sometimes used as a sort of alternative to the RSI, with zones above the +100 line and below the -100 line representing overbought and oversold factors, respectively.
The CCI still inspires countless traders to create new applications. For example, the well-known American trader Ken Wood made his name by identifying visual patterns in the CCI.

PARAMETERS
- MA period (14)
- MD period (14)
- Help line (100)
BUY AND SELL SIGNALS
The zero line crossings of the CCI provide buy and sell signals.
DIVERGENCE
Yes
INDICATOR TYPE
Oscillator
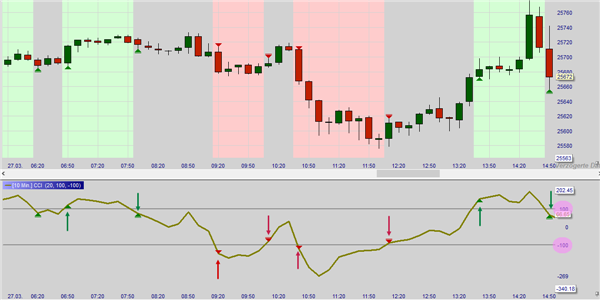
This example shows a 10-minute chart in the NanoTrader trading platform. At the bottom the trading conditions for the CCI are clearly visible. If the CCI rises above the +100 line, a buy signal is generated. The exit occurs when the +100 line is crossed downwards again. Exactly the opposite is the case with the short signals. If the CCI falls below the -100 line, a sell signal is generated. The exit occurs when the -100 line is crossed again at the top.