The Keltner Channel consists of two bands that are calculated using a 20-bar exponential moving average (EMA), with the 10-bar Average True Range, multiplied by a selectable factor, being added or subtracted from the average (the EMA middle line of the channel).
Click here to see the Keltner Channel inside a real time trading platform.
This is reminiscent of the Bollinger Bands, which are calculated with the standard deviation. The values of the ATR and standard deviation display some similarities with one another. Depending on the ATR, the trend channel widens or narrows. Often two Keltner Channels are used, one with the setting 1 x ATR and the other set to 2 x ATR.
Most of the price movements take place between the –1 and +1 limits of the Keltner Channels. However, the key focus is to monitor when prices begin to exceed these limits or even approach the –2 or +2 limits.
This signifies that there is a greater chance of prices moving back towards the middle of the channel in the near future. This is known as ‘reversion to the mean’.
PARAMETERS
- ATR period
- Band factor
BUY AND SELL SIGNALS
N/a
DIVERGENCE
N/a
INDICATOR TYPE
Various
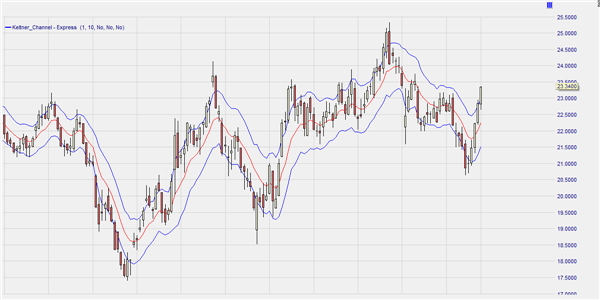
The following example shows just how similar the Keltner Channel looks from the Bollinger Bands. To keep things simple we chose only show the +1/-1 range in which most of the price moves take place.