Martin Pring’s KST indicator comprises a series of exponential moving averages (EMAs) from various ROCs.
Click here to see KST swings inside a real time trading platform.
Not only do these ROCs have different time frames, but they also have differing weights – the longer the ROC’s time frame, the greater the weight. The calculation illustrates the weight schedule for the daily KST. The KST can also be used with weekly and monthly prices in order to analyze the three different trends: the short-term trend (daily prices), the medium-term trend (weekly prices) and the long-term trend (monthly prices).
The key time frame for the KST construction is the longest-term ROC, which also gets the biggest weight. For a month-based KST, this might, for instance, be the 24-month period. Due to its use of multiple time frames, this indicator is characterized by its ability to accurately indicate the major trend and signal reversals within it in a timely manner. Pring admits that the KST buy and sell signals perform better when a longer period is used, such as weekly or monthly prices.
According to Pring, the KST can be interpreted in three different ways, namely:
- buy and sell signals
- overbought and oversold positions
- divergences and trend lines
A buy or sell signal is triggered when the KST line crosses its EMA in either a downwards or an upwards direction. Pring states that KST signals are reliable when seen together with a distinct price pattern or significant penetration of the trend line. The second way to interpret the KST is to use it as an overbought/oversold oscillator. The KST is not a momentum indicator with fixed overbought and oversold areas. For this reason one needs to use the stock or an index to determine what the extreme historical values are.
Click here to get a free demo account.
PARAMETERS
- ROC1 (10)
- EMA1 (10)
- ROC2 (15)
- EMA2 (10)
- ROC3 (20)
- EMA3 (10)
- ROC4 (30)
- EMA4 (10)
- KST signal line EMA(10)
BUY AND SELL SIGNALS
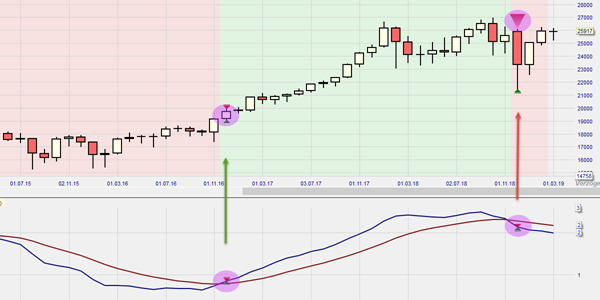
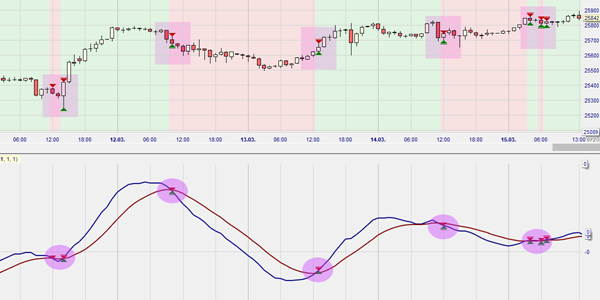
A buy or sell signal is triggered when the KST line crosses its EMA in either a downwards or an upwards direction.
DIVERGENCE
Yes
INDICATOR TYPE
Trend-following
This example shows the KST indicator in the NanoTrader trading platform on a 1-month chart. In the lower part of the chart the two KST lines are shown. Long signals and short signals are generated due to the intersection.