Gerald Appel’s Moving Average Convergence/Divergence (MACD) is the difference of two Exponential Moving Averages (standard periods: 13 and 26).
Click here to see the famous MACD inside a real time trading platform.
The MACD is calculated by subtracting the 26-day exponential moving average (EMA) from the 13-day EMA. A 13-day EMA of the MACD, called the "signal line", is then plotted on top of the MACD, functioning as a trigger for buy and sell signals.
The difference of the MACD lines indicates market sentiment. The greater the difference, the stronger the sentiment (positive or negative). When MACD lines converge on one another, a trend reversal is imminent. A further indication that the trend is about to turn is when the MACD and the price chart run in contrary directions (divergence). The MACD is the pre-eminent trend-following indicator. Performance in sideways markets is often disappointing.
The MACD is easily optimized, something to which it owes its popularity. However, pay close attention to what happens during optimization in potential trading-market periods. Surviving these trading-market phases unscathed is crucial to successful application of the MACD system.
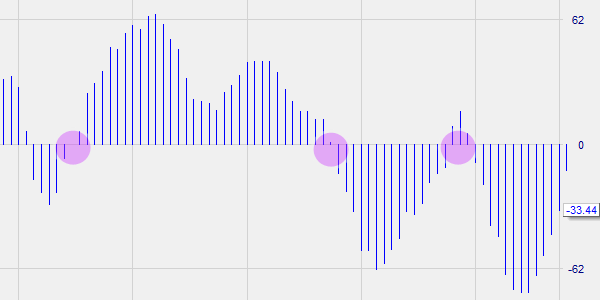
This indicator is also often presented as a histogram with the difference between indicator and signal line signified as MACD differential or MACD histogram.
PARAMETERS
- MA period 1 (13).
- MA period 2 (26).
- MA period 3 (13)
BUY AND SELL SIGNALS
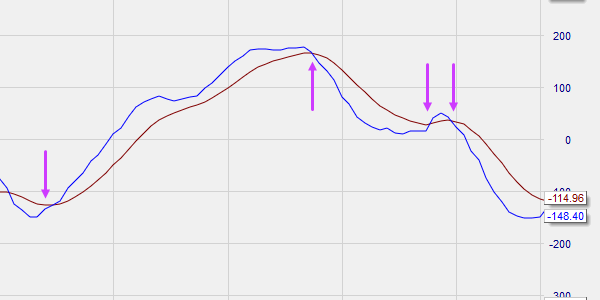
The crossing of the MACD lines is considered a buy or sell signal.
DIVERGENCE
Yes
INDICATOR TYPE
Oscillator
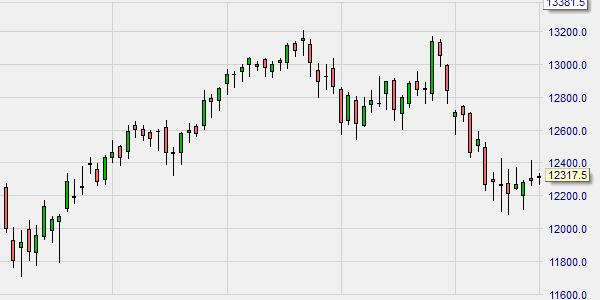
This example shows a day chart.

Based on the price evolution the MACD line (1) is calculated using 12 periods for the fast EMA and 26 periods for the slow EMA. The signal line (2) represents an EMA calculated over 9 periods.

The MACD histogram indicates the delta between the MACD indicator and the signal line.


