The Money Flow Index, or MFI, is an indicator that displays a stock’s flow of capital. The indicator is comparable to the RSI Index, but the RSI does not utilize volume information. A high MFI value means that the market is buying in large volumes (overbought). A low MFI value means that large volumes are being sold (oversold).
Divergences are key to the MFI, so if this indicator falls while the price rises, a trend reversal can be expected. The same goes for a rising MFI in a bearish market.
With an MFI above 80, the market is probably approaching a top. With an MFI below 20, the bottom is likely to be in sight.
Apply here for a free NanoTrader demo.
PARAMETERS
- MFI period
- Overbought
- Oversold
BUY AND SELL SIGNALS
N/a
DIVERGENCE
Yes
INDICATOR TYPE
Volume indicator
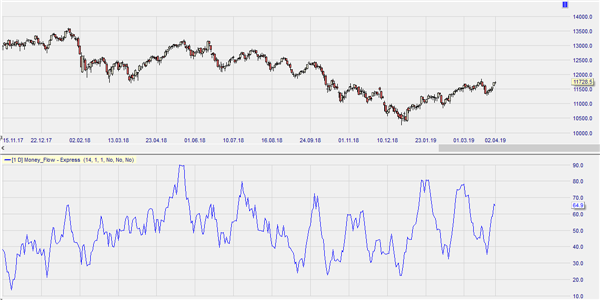
This example is showing MFI on the FDAX on a daily chart inside NanoTrader. Peaks in volume above 80 indicate the market might be overbought. We do in fact see markets cooling down after such peaks are reached.

Apply here for a free NanoTrader demo.

Free newsletter: Trading signals based on technical analysis.
The analysis of the market has become easy! Create your own daily newsletter with signals based on important concepts of technical analysis. All your preferred financial instruments are available.
It's that simple. REGISTER HERE