A Moving Average (MA) averages price movements across a given period of time. As an example, in its standard form, this indicator aggregates all the closing prices of the last thirty days, and then divides them by thirty.
Click here to see a Moving Average inside a real time trading platform.
The most common interpretation is as follows: as long as prices exceed the MA, the stock should be bought, but if prices move below the MA, then it should be sold. The points at which the MA crosses the price trend (known as crossover) represent buy or sell moments.
The disadvantage of the MA is that, subject to the selected period, it lags the current price. It is therefore a lagging indicator. The Moving Average is a typical trend-following indicator. The MA indicator is not very useful in a trading market as it gives many false signals.
The MA can be easily optimized. But is also notorious for so-called curve fitting. The optimized setting often endows the MA a curve which gives past signals at precisely the right moment. The probability that this curve fit is repeated exactly in the future is of course remarkably small. A fact that has given optimized MAs a bad name. However, in consistently strong trend markets, optimization is definitely an option. It is usually pointless optimizing an MA in trading markets though.
The Moving Average is used both by traders with a short parameter of, for instance, 10 days, and by long-term investors with a parameter of say 200 days. Working on a weekly basis, a parameter of 40 weeks could be selected for a longer-term horizon.
PARAMETERS
MA period (30)
BUY AND SELL SIGNALS
Buy/sell signals are triggered when the MA crosses the price line.
DIVERGENCE
N/a
INDICATOR TYPE
trend following indicator
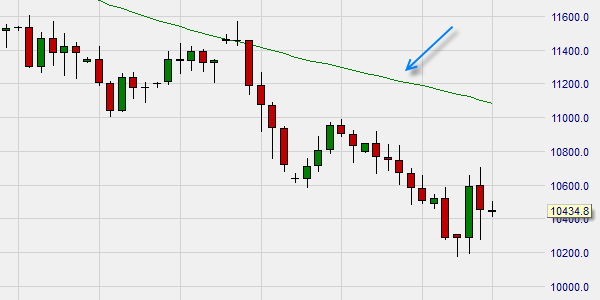
This example shows a daily chart with a 50-day moving average in the NanoTrader trading platform.

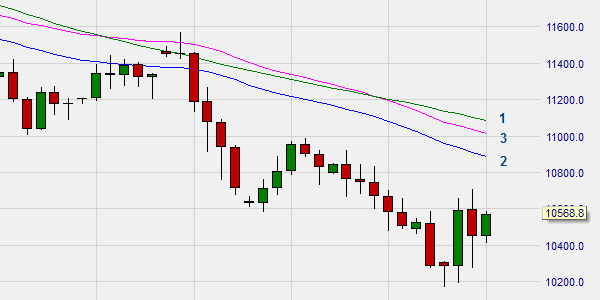
This example shows three moving averages in the NanoTrader trading platform: Simple (1), Weighted (2), Exponential (3).


