Article 3 - No risk, no reward. This is of course nothing more than a truism, but when assessing a strategy we surely want to know whether the risk we are running is proportional to the expected returns. Making a small profit while running a big risk of large losses on a trade (drawdown) is something we aim to prevent as much as possible. After all, we would then run the risk of a margin call (e.g. with futures, options and leveraged investments) and would have to close the trade at a loss in the absence of insufficient resources while the strategy itself is still in the market.
The advantages of the risk-return ratio:
- Improved assessment of risk in relation to expected return.
- Relates what you win to what you can lose and uses objective criteria such as number of trades, hit rate, time spent in the market, etc.
In order to be able to quickly assess a strategy in this respect, a number of indicators have been developed. At this point, we use the WS Index and the RINA Index. Both are described below:
WS Index
The WS index (developed by Keyword) shows the risk-return profile of a trading system. The higher the index, the better the risk-return profile.
The index is calculated as follows:
WS Index = 10,000 * (Average result per trade) / ((Maximum loss) * (Percent time in the market)).
Average result per trade: This is the average result per trade.
Maximum loss: This is the maximum loss of a trade, calculated over all trades.
Percent time in the market: This is the length of time the trading system takes a position. A trading system that invests only a limited period of time in the market therefore receives a higher WS index.

RINA index
The RINA index shows the risk-return profile of a trading system. The higher the index, the better the risk-return profile. According to the author (RINA Systems, Inc.), the RINA index for a good trading system should have a minimum value of 30.
The index is calculated as follows:
RINA Index = (Select Net Profit) / ((Average Drawdown) * (Percent time in the market))
Select Net Profit: Select Net Profit is the net result of only those trades whose result is below the average result plus or minus three times the standard deviation. Trades with an extremely low or high result do not count.
Average Drawdown: This is the average drawdown (average loss) per trade, calculated over all trades.
Percent time in the market: This is the length of time the trading system takes a position. A trading system that invests only a limited period of time in the market therefore receives a higher RINA index.
RINA compared to WS
The RINA index corrects the result by not counting the extremely profitable and loss-making trades. For some trading systems, however, this leads to an undesirable result. If your trading system produces many small (loss) trades in one trading area and only a few long term profitable trades that follow the trend, the RINA index will show a low or even negative value.
A successful strategy usually shows clearly positive values for both the WS index and the RINA index. In good systems, these are usually in the range of 10 - 100, but higher or lower values also occur. If the value for both indexes is negative, this is usually a sign of a change to another system.
Other criteria
In addition to these two important indices, other evaluation criteria are also relevant.
Net profit: This is the profit a strategy has made over a period of time, including slippage, spread and cost.
Number of trades: This is the total number of trades executed. The more trades you make in a given period, the more difficult it will naturally be to approach the fictitious return in a live situation due to the additional slippage and costs.
A backtest with few trades leads statistically to a bad basis. A somewhat more reliable statistical result is only possible from 50 trades. If there are less than twenty, the results must be viewed with caution.
Hit rate: The "hit rate" is the number of profitable trades/total number of trades.
Maximum consecutive loss trades: An important psychological factor is the so-called "losing streaks". It is very difficult to build up sufficient confidence in the system after e.g. 6 consecutive loss trades. Not to mention after 10 or 15 loss trades! However, it is not statistically abnormal that this will happen. Remember, the lower the hit rate of your system, the more likely you are to face significant loss series.
Average profit/average loss (P&L): This is the ratio of average profit/trade and average loss/trade, also often referred to as P&L (profit and loss). In addition to the hit rate, this value is an important measure for assessing a strategy in terms of profit expectations and the probability of ruin.
A system can have a low hit rate of e.g. 45%, but still be profitable because the P&L has a ratio of 2:1.
Profit expectation per trade: The profit forecast is the expected average profit per trade and can be calculated from the hit rate (H) as well as the average profit and the average loss.
Profit per trade = total profit / total number of trades
If you only have this data: hit rate, average profit and average loss, you can use the following calculation:
Profit per trade = (H* average profit) - ((1 - H)* average loss)
Are you looking for an outstanding futures and CFD-Forex broker?

In the annual Brokerwahl traders voted WH SelfInvest as "Nr. 1 Futures Broker" and "Nr. 2 CFD Broker". For an incredible five times in six years WH SelfInvest is considered the best futures broker, beating all competitors by a wide margin. In CFDs WHSelfInvest came only 0,1 behind this year's first-placed broker. Clients are extremely satisfied with the low commissions, outstanding order execution and the legendary service.
Test WH SelfInvest, download a free demo.
Probability of Ruin (POR)
Suppose we have a good system that looks good in terms of return and risk. Nevertheless, there is a danger that we will go bankrupt if we act in a live situation. This POR risk is described by Lucas & Le Beau in the book Computer Analysis of the Futures Market. We also counter this risk in probability calculation and game theory. Here is an example. One evening you go to the casino with €250. You want to survive the whole evening without any major losses and bet on black or red at the roulette table. Each time you place a €10 chip on black or red, you have the same chance to double or lose the bet in each round (the zero of the bank is not taken into account here for clarity). Your expectation is that you will return home with about €250 at the end of the evening. However, there is a 50% chance that Roulette will turn against you and you will be unlucky enough to leave the casino with only about €125! We call this 50% chance Probability of Ruin.
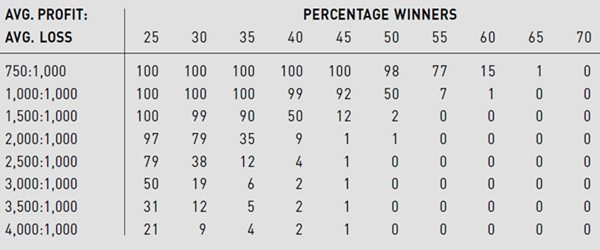
The same can of course happen during trading. In the table of Lucas and Le Beau you can look up the POR of a trading system. This is based on a trading account of €25,000, with 4% of the account (€1,000) at risk with each trade. The amount at which the system is at risk of bankruptcy is set at €12,500. The system is considered successful when the counter has risen to €50,000.
In the table you can see the hit rate of your system. On the left you can see the average profit/average loss (P/L). In our casino example, the hit ratio is 50% and the P/L is 1:1. The POR (50%) is derived from the table. Only with a hit ratio of 50% and a P/L of 2.5:1 will you be saved from bankruptcy (unfortunately this is not the case in a casino). The backtest from which you retrieve this data must contain at least 50 trades in order to draw reliable conclusions. And even then, it can go wrong. While trading, the market may change in character, so the hit rate and P/L of your system may change. Therefore, you should do regular backtesting during trading to avoid being surprised. A strongly flattening or decreasing asset curve can also be a signal for evaluating your system.
This table shows the hit rate according to the Probability of Ruin (POR) (Lucas & LeBeau)
Statistics and investment
A coin is flipped up 100 times. After 99 head falls, a statistician is asked how big the chance is that the next toss will be head again. He answers: '50%'. Next, a trader is asked what the chances are that his head will fall. He answers: "Almost certainly head again, because there must be something wrong with the coin". - Perry Kaufman.
The above anecdote illustrates very well how a trader should use statistics in practice. He expects statistical knowledge, but at some point he will have to dare to make a decision. While a statistician would probably continue to argue that everything is just a matter of chance.
A trader must therefore be able to deal with the uncertainty of decisions based on past experience. However, humans tend to recognize patterns in random events too quickly, even though they are not actually present. If, for example, you purchase a product of the same brand three times with a defect, you will quickly come to the conclusion that it is a bad brand. But you don't have to be a statistician to see that a sample of three can't give a reliable result.
On the other hand, we tend to downplay very small risks with large impacts when they have not occurred for a long time. Investors are particularly good at this. A very small chance of a very large loss, e.g. due to a stock market crash, is often neglected. The longer it has been and the more it disappears from memory, the less it is taken into account. This is also the reason why 9/11 and the banking crisis have so strongly influenced the market. If things go well on the stock market for a while, the risks are repeatedly underestimated; "Because this time it's different". The five most dangerous words an investor can say.
Statistics of a trading system
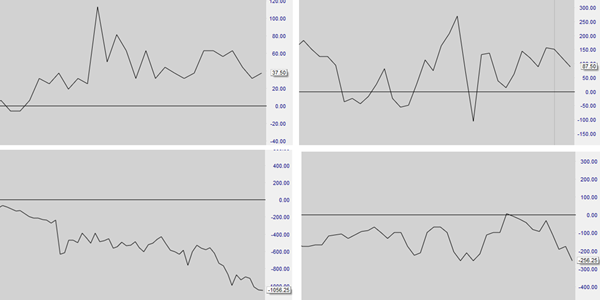
As we have seen, there are many perspectives on a trading system, for example: the number of trades, drawdown and risk/return ratio (e.g. WS or Rina Index). These are all key criteria for valuation. The average profit and loss ratio (P/L ) and the probability of a profitable trade ("hit rate") are important factors in determining the probability of bankruptcy, the Probability Of Ruin (POR). We can consider P/L together with the "hit rate" as a kind of engine power of the trading system. A low hit rate requires a high P/L, a high hit rate (more than 70% is already high) often shows lower P/L values (less than 1). Trading systems with a high value for both are unfortunately rare. According to the table by Lucas and LeBeau, with a hit rate of 50%, the P/L must be at least 2.5 to bring the probability of bankruptcy to almost zero. With a P/L value of 1.5 and a hit rate of 50%, this chance is 2%. And with a P/L value of 1 and a hit rate of 50%, the POR is even 50%. Nevertheless, statistics remains a phenomenon that is difficult to fathom. Even if the probability of a bankruptcy is almost zero, there is always a (very small) chance that it will happen! Figure 2.3.2 shows an Excel simulation of a system with a P/L of 1.5 and a hit rate of 45%. The POR table of Lucas and LeBeau shows a 12% probability of bankruptcy for these baselines. In several runs, 48 trades were simulated in a highly simplified trading model. Although the vast majority of runs after 48 trades are ultimately profitable, it appears that the equity curves generated with random trades can look very different in practice. So always be mentally prepared for any possible outcome!
This example shows four possible asset curves in the NanoTrader trading platform.