Pivot Points indicate the support and resistance levels for the coming day. Due to the simple calculation involved, Pivot Points were popular with floor traders before they had access to computers and software.
Click here to trade like a floor trader using Pivot Points inside a real time trading platform.
The reason Pivot Points are still so popular is that the market often reacts around the calculated levels. This is entirely due to the fact that many (day)traders follow these Pivot Points. This often provides excellent opportunities for taking a position.
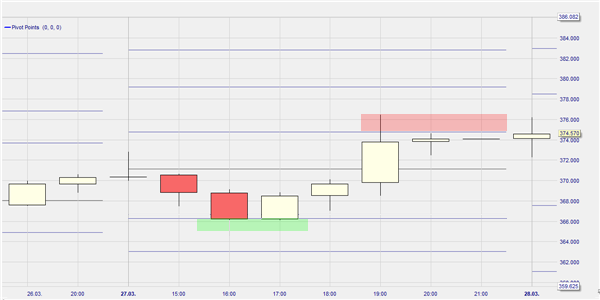
The following example shows how the Pivot Points really work as a guideline for traders. Based on yesterdays data, the Pivot Lines are set out for the next day. As soon a Pivot Points is hit, prices stabilize. We first see the market finding a support level (green zone) to bounce on and then next another Pivot Point is acting as resistance level (red zone) until the close of the session.