The RAVI (Range Action Verification Index) indicator was developed by Tushar S. Chande and is described in his book Beyond Technical Analysis. This indicator is quite a bit simpler to calculate than the ADX, but is no less effective.
Click here to see how the RAVI works a real time trading platform.
It applies two unweighted Moving Averages. The first is 13-weekly, which is comparable to a 65-day MA, and the second MA is 10% of the previous 'long' MA, rounded off to a 7-day MA. The length of the MAs may be adjusted at the user’s discretion. The RAVI is now defined by taking the absolute difference between the 7-day MA and the 65-day MA.
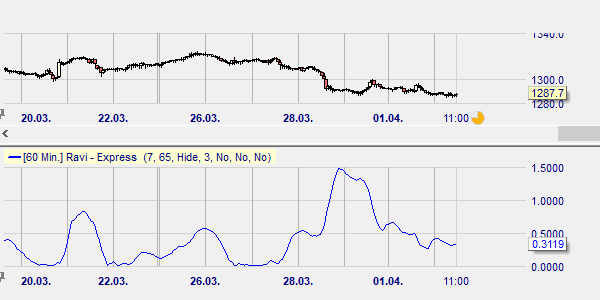
The interpretation of this indicator is comparable with that of the ADX. Above a certain value (± 3), the market is in a trend, but below this value it is in a trading range.
PARAMETERS
- Short MA period
- Long MA period
BUY AND SELL SIGNALS
N/a
DIVERGENCE
N/a
INDICATOR TYPE
Trend indicator
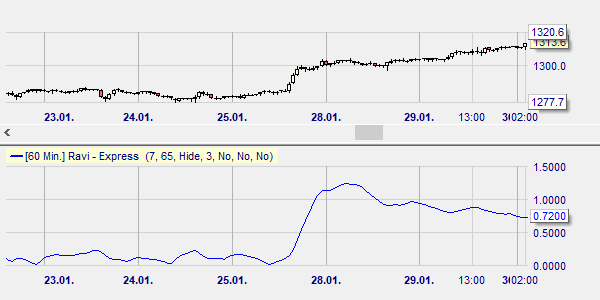
In the example below we see how the RAVI has caught an upward trend in the daily chart on Gold. As the trend stops and the market returns to a more sideway pattern, the RAVI value stabilizes and decreases as well.