The RSI, or Relative Strength Index, is a popular indicator largely derived from visual analysis, which was developed J. Welles Wilder Jr.The RSI was developed to accurately detect extreme price movements.
Click here to detect extreme price movements inside a real time trading platform.
A very high RSI value could indicate an overly fierce price movement, after which prices could correct downwards. A low RSI value stands for a weak price movement. A very low RSI value usually means that prices have fallen too far, with a technical rally as the result.The RSI must not be confused with Relative Strength (RS), where the price of a specific stock is compared with the price of another stock or security.
Generally speaking, a stock’s RSI oscillates between two fixed values. If the chart exceeds the 70% line, then the stock is overbought. If it breaks the 30% line, then the stock is oversold.
The RSI buy/sell signals with the standard parameters can only be used in a trading market.
The closer the input oversold/overbought levels get to the 50% zero line, the more trend-following and lagging the signals become. The crossings of the RSI line with the 50% value are in effect trend-following signals, i.e. an upward crossing is a buy signal and a downward crossing is a sell signal.
The RSI is a popular indicator among technical analysts. It owes its reputation largely to the support provided by visual technical analysis, using divergences, for instance. As a stand-alone trading system, RSI performance is usually moderate.

PARAMETER
- RSI period (14)
- Oversold level (30)
- Overbought level (70)
BUY AND SELL SIGNALS
The RSI provides a buy signal when the indicator line crosses the oversold line in an upward movement, and a sell signal if the indicator line crosses the overbought line in a downward movement.
DIVERGENCE
Yes
INDICATOR TYPE
Oscillator
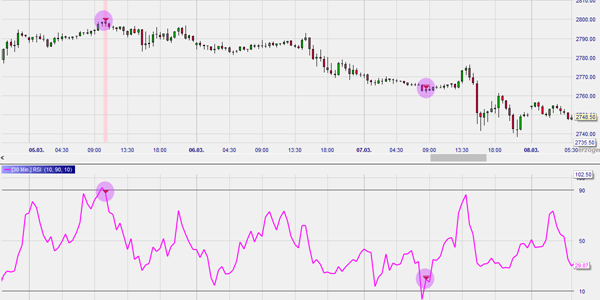
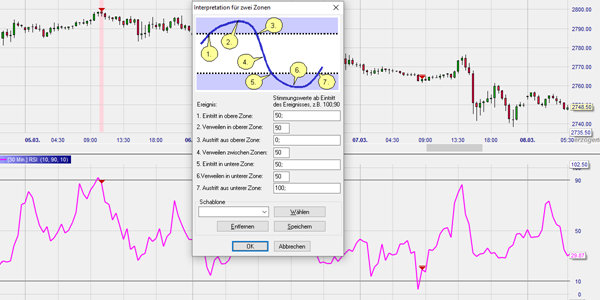
This example shows an RSI indicator based on the 30-minute chart in the NanoTrader trading platform. The oversold level was set at 90 (Threshold Long) and the oversold level at 10 (Threshold Short). If the overbought line is crossed , a sell signal is generated. In the NanoTrader this is indicated by red arrows. Here, the interpretation can even be viewed and conveniently edited.
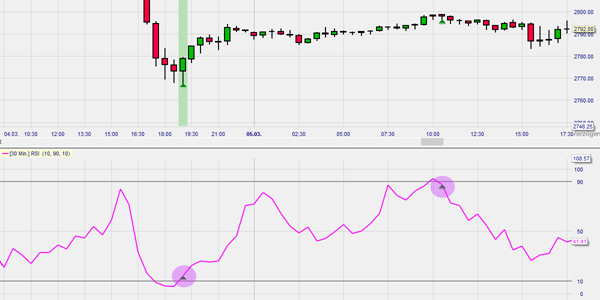
If there is an upwards crossing of the oversold line, a buy signal is generated.