
Breakout systems time trades at moments that they reach new highs or lows in a given period. This breakout principle is used as a signal to time a trade.
Click here to practise the timing of a trade inside a real time trading platform.
In its simplest form it is a trend-following indicator, with the aim of riding the trend for as long as possible after the signal. Until the next counter-breakout, for example. The simple outbreak indicator constantly recalculates the lowest price of each bar for the previous x-period (adjusted separately), illustrating this in the chart. When the price of a bar is lower than the lowest of x-period (past), then a sell signal is generated. When the price of a bar is higher than the highest of x-period (past), then a buy signal is generated.
PARAMETERS
- Outbreak period Highs
- Outbreak Period Lows
BUY AND SELL SIGNAL
When the price of a bar is lower than the lowest of x-period (past), then a sell signal is generated.
When the price of a bar is higher than the highest of x-period (past), then a buy signal is generated.
DIVERGENCE
N/a
INDICATOR TYPE
Trend-following
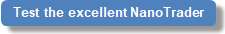
This example shows a variant of the Simple Outbreak indicator as Channel Breakout in the trading platform NanoTrader. The period length for determining the highest and lowest prices is defined. It also defines the number of consecutive period highs for a positive breakout and the number of consecutive period lows for a negative breakout. In the example, the period length is 10, based on a 60-minute chart. The number of new period highs and lows has been set to 2.
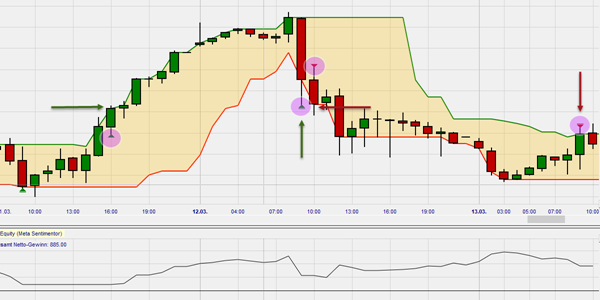
This example shows a variant of the Simple Outbreak Indicator as a High-Low Channel in the trading platform NanoTrader. From the highs and lows of a selected number of periods, a moving average is build, which forms the upper and lower band in the chart. If an upward cross is made in the upper band with a new, higher closing price, then there is a buy signal, if a candle falls below the lower band and forms a new, lower closing price there, then there is a sell signal. Other events such as staying below or within the bands are interpreted as neutral events. These events are assigned values in the NanoTrader. In addition, the background can be coloured green (long), red (short) and neutral.

"The NanoTrader platform is magnificent." – Kai
"NanoTrader is my fourth trading platform and it is by far the BEST platform." – Henry
"I have already familiarized myself a little bit with the platform and I can tell you, that it is the best trading platform I have ever used." – Peter