The Stochastics indicator, developed by George Lane, basically consists of two oscillators: the %K line and the %D line.
Click here to test the Stochastics inside a real time trading platform.
It is calculated based on the assumption that the market becomes stronger when closing prices approach the highest price of the day, while the market gets weaker when closing prices draw near the day’s lowest price even when the highest price is higher than that of previous days.
When the Stochastics reach the 100 level, this indicates accumulation (buyer’s market); the 0 level suggests distribution (seller’s market).
The shape of the Stochastics can be an indication of what is coming. If the Stochastics are forming a narrow and shallow bottom, this suggests a weak downtrend which could be followed by a strong upward movement. A wide and deep bottom indicates a strong downtrend. The same goes for Stochastic tops in an uptrend.
The standard buy and sell signals in the form of the %D-%K crossings only work well in a trading market.
Treating Stochastics in a purely mechanical fashion – whether or not the indicator has been optimized – often leads to disappointment. Although the hit rate is often high, especially in trading markets, the P/L ratio is generally quite low.
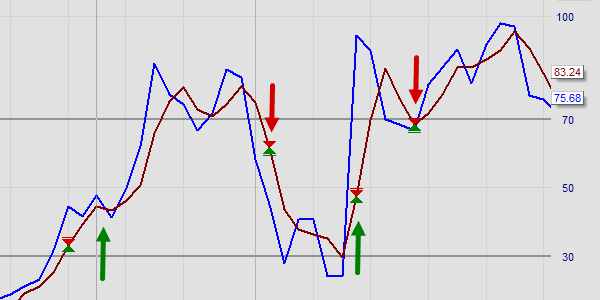
This example shows the entry and exit moments in the NanoTrader trading platform with thresholds of 70 and 30.

However, thanks to its excellent timing (high hit rate), Stochastics is a well-used indicator among traders. Traders try to improve the low P/L by better timing exits and by combining Stochastics with visual patterns. The combination with candlestick patterns is particularly popular among day traders (see below). The visual shape of the Stochastic also suggests certain effects. The more the form of the Stochastics emulates a sine, the more reliable the signals become. Divergences with the price chart can also provide good signals.
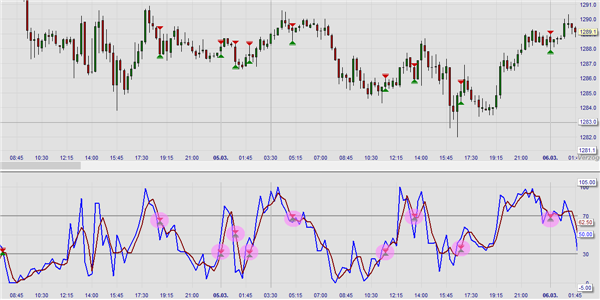
This example shows the Stochastic indicator as a subwindow in a 30-minute chart in the trading platform NanoTrader and the development of the entry and exit signals.
PARAMETERS
- %K period (5)
- %K slow period (3)
- %D slow period (3)
- Oversold level (15)
- Overbought level (85)
BUY AND SELL SIGNALS
Buy or sell signals are generated when the %D line crosses the %K line below the oversold level (or above the overbought level).
DIVERGENCE
Yes
INDICATOR TYPE
Oscillator
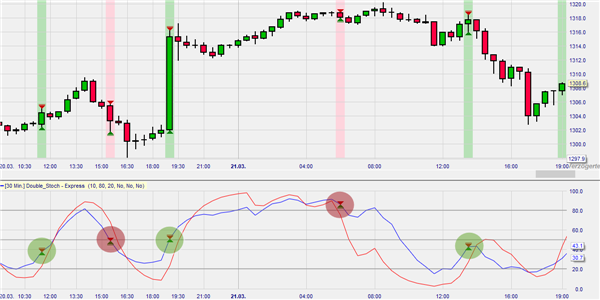
Variant: Double Stochastic
The double stochastic indicator is a derivative of the stochastic indicator. This indicator is widely used in the so-called cycle analysis and is calculated by performing a further %K calculation on the %K line (i.e. double stochastic) and then providing it again with a moving average. With the 10-days double stochastic bottoms (and tops) cycles are to be found in the pattern. The indicator moves between 0 and 100, below the level of 30 is considered a bottom and the tops are 70. A shorter 5-period double stochastic can be used to extract the shorter cycles from the price chart.
PARAMETERS
- Span %K: Number of periods for the %K-calculation
- Span %K Slow:
- Span %D Slow:
- Overbought Threshold: beginning of the overbought zone
- Oversold Threshold: beginning of the oversold zone
BUY AND SELL SIGNALS
Buy or sell signals are given when the %D line breaks through the %K line below the oversold level (or above the oversold level).
DIVERGENCE
Yes
INDICATOR TYPE
Oscillator
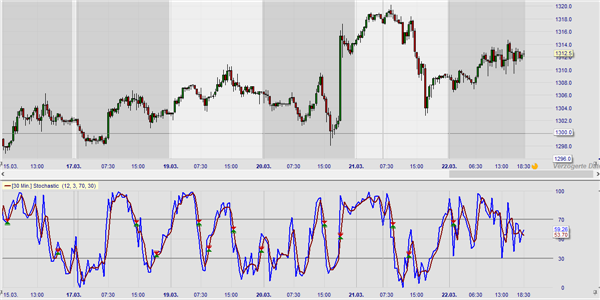
This example shows the Double Stochastics indicator based on a 30 minute chart in NanoTrader platform.
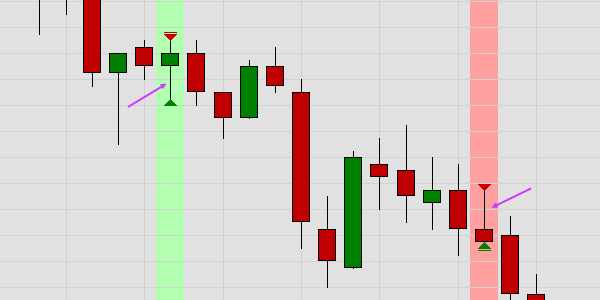
The Stochastic indicator is often used by traders together with Japanese candle charts. Look for long shadows under or above the candle body. These are candles that represent a buy or sell signal and can be a confirmation of a Stochastics signal.
This example shows candle formations that can confirm a Stochastics signal.
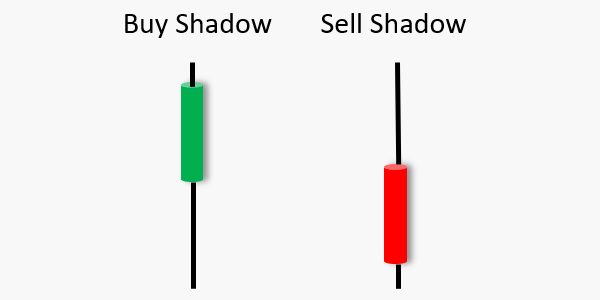
This example shows a confirmed signal based on the mentioned "Buy Shadow" and "Sell shadow" in a candle chart of the NanoTrader trading platform.