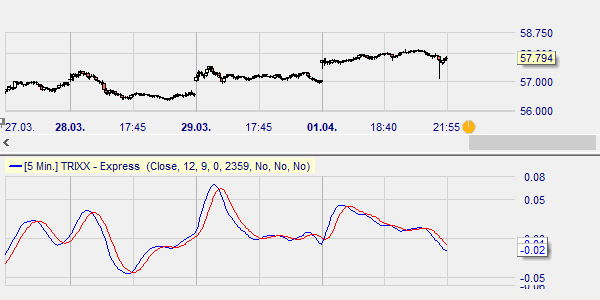
The TRIX indicator, created by Jack Huton, is the 1-day Rate of Change of a triple Exponential Moving Average (EMA). It moves around the zero line. The triple EMA is designed to filter out all small price fluctuations.
When the TRIX indicator changes direction, this indicates a trend reversal. A buy/sell signal is generated using the TRIX indicator’s EMA signal line.
Like the CCI and the ROC, the TRIX is an oscillator that performs best in a strong trend market.
The TRIX can be easily optimized, but is vulnerable to curve fitting.
One variant of the TRIX is the TRIX Dynamic. The buy/sell signals are different, but the calculation is the same.
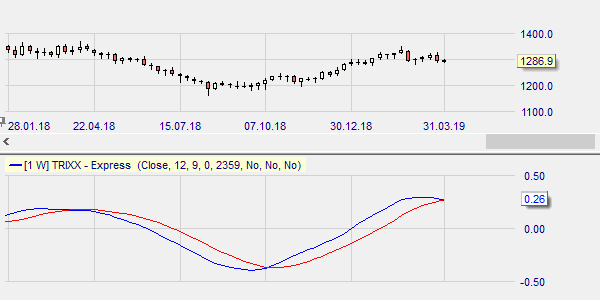
TRIX and TRIX Dynamic often deliver surprisingly good results in different markets using weekly instead of daily prices.
This example shows a series of reliable buy and sell signals on a weekly chart on Gold inside the NanoTrader trading platform.
PARAMETERS
- TRIX Period (12)
- EMA period of the TRIX line (5)
BUY AND SELL SIGNALS
The crossings of the TRIX line with the EMA signal line constitute buy-sell signals.
DIVERGENCE
Yes
INDICATOR TYPE
Oscillator

Free newsletter: Trading signals based on technical analysis.
The analysis of the market has become easy! Create your own daily newsletter with signals based on important concepts of technical analysis. All your preferred financial instruments are available.
It's that simple. REGISTER HERE