The VHF (Vertical Horizontal Filter) was developed by Adam White, and is also designed to indicate whether or not a stock is in a trend phase.
Click here to see VHF inside a real time trading platform.
As standard, the VHF is calculated over a period of 28 days. Firstly the difference between the highest and the lowest prices over this period is worked out. Then the difference between the current and previous days’ closing prices is calculated. These differences are added regardless of positive or negative values. The results of both calculations are now divided by one another.
The VHF indicates whether there is a trend, without defining whether it is an upward or a downward trend. In this sense it is similar to the ADX and the RAVI. The higher the VHF signal, the stronger the trend in the stock (falling or rising).
We have already briefly covered the concept of noise in relation to the trend. The VHF value is adjusted for the degree of noise by the denominator of the calculation. The greater the noise, the lower the value. In other words, in a volatile market, the VHF calculation will be slower to identify a trend. When the VHF begins to fall, this is an indication of an imminent trend reversal or transition to a sideways movement in the market.
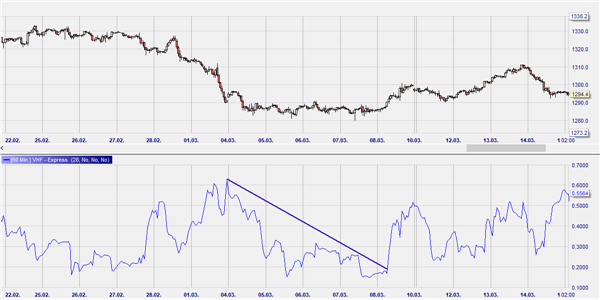
Trend lines can be used when applying the VHF, as a penetration of these lines can confirm a trend reversal.
PARAMETERS
- Period
BUY AND SELL SIGNALS
N/a
DIVERGENCE
N/a
INDICATOR TYPE
Trend indicator
This example shows how drawing trendlines based on the VHF-line can be a very effective way to spot a trend reversal. The trend has been downwards for several days. At the moment where the trendline is broken, the trend changes and we witness the start of a consistent upwards move.