The volatility indicator displays a stock’s historical volatility. Volatility indicates the degree to which a stock’s price is fluctuating. It is used, for instance, to calculate the theoretical options value. A study of volatility can be used to write expensive options if volatility is high, only to buy them back cheaper once volatility decreases. The volatility chart can be further examined by detecting visual trends.
Volatility as risk gauge.
The theory of money-management often uses volatility to determine the risk of a stock. The more a stock fluctuates, the higher the risk, but also the higher the potential gains.
Apply here for a free NanoTrader demo.
PARAMETERS
- Period: the number of days over which volatility must be calculated
BUY AND SELL SIGNALS
N/a
DIVERGENCE
N/a
INDICATOR TYPE
Volatility indicator
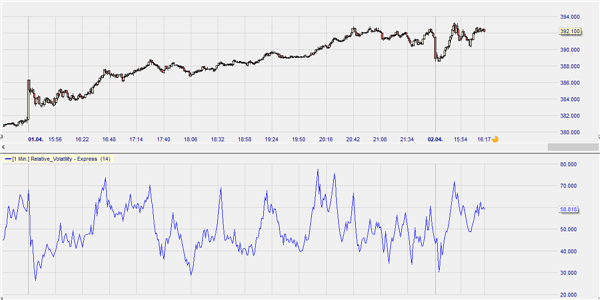
This example shows the relative volatility of a US stock over the course of one trading day.