The "inside bar" candlestick pattern is a chart pattern which consists of a series of candles that are all closing inside the High-/Low range of the first candle of the series, often referred as the outside bar. This means that the close price of the current candle is both lower than the high of the first candle and higher than the low of the first candle of the pattern.
Inside bars indicate a period of consolidation in a market and they often form following a strong move in a market, as it pauses to consolidate before making its next move. However, they can also occur at specific market turning points and could therefore also be used as promising reversal signals.
Inside bar patterns were also suggested by the famous German trader and author Michael Voigt ("Das große Buch der Markttechnik") to determine the level of the stop loss order to capture robust gains when trading strong price movements.
A trading signal appears when the market breaks out above or below the inside bar range.
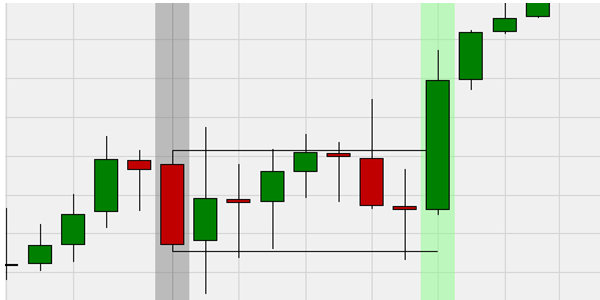
In this example an inside bar pattern was identified when the second candle of the pattern closed inside the High-/Low range of the previous candle. The often as outside bar referred first candle (grey background) established a price channel based on the high and low price of the outside bar. The price channel was drawn until the first candle closed above the channel indicating a buy signal (green background).

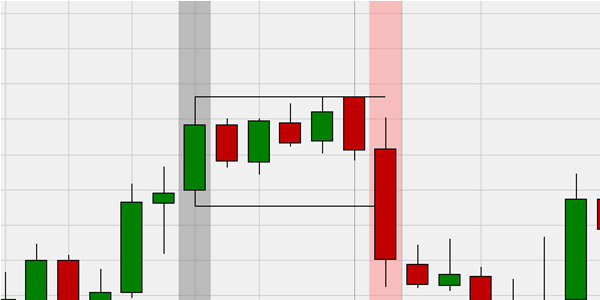
In this example an inside bar pattern was identified when the second candle of the pattern closed inside the High-/Low range of the previous candle. The often as outside bar referred first candle (grey background) established a price channel based on the high and low price of the outside bar. The price channel was drawn until the first candle closed below the channel indicating a sell signal (red background).

