
One name that keeps coming up in connection with the charting tools that are now called classic indicators is that of Wilder. The Average True Range is no exception, which was also developed by Wilder and is one of the most widely used volatility measures within technical analysis today.
Presented in his 1978 book New Concepts in Technical Trading Systems, Wilder tried to develop an indicator with the Average True Range (short ATR), which shows the fluctuation range of commodity and futures markets. Such indicators already existed at that time, but they were mainly based on the daily fluctuation range within the trading day or their average values. For Wilder, however, these methodologies did not reflect the true fluctuation margin sufficiently; after all, only the candle sizes were measured by subtracting the daily low from the daily high (or in other time levels: candle low-candle high).
Although this allowed the trading range during trading hours to be well captured, it only reflected part of the real price movement, especially in volatile markets. Volatile markets in particular were characterised by price gaps between two opening prices, which were not covered by previous concepts. However, if a position is held overnight (or from one candle to the next), these price jumps hit an investor in full - even if he himself has no chance of reacting.

Against this background Wilder presented his "true average fluctuation range", the ATR. Instead of only looking at the daily trading range between candle highs and lows, gaps were considered. Therefore, some additional conditions had to be checked:
Span 1 = candle high - candle low
Span 2: If today's closing price is higher than yesterday's, then: Span 2 = today's high - yesterday's closing price
Span 3: If today's closing price is lower than yesterday's, then: Span 3 = yesterday's closing price - today's low.
Picture1 shows a schematic representation of the market opportunities.

From this case distinction, the true range results as the maximum available price range from S1 to S3, which can be plotted continuously below the chart (see Pic. 2).
Here s a free demo of the Guidants trading platform.

It is easy to see that the true range itself is subject to large fluctuations and is therefore only of limited use. This finally leads us to the Average True Range, the average true fluctuation margin. As the name already suggests, the True Range is smoothed by forming an average value. For this purpose, the trader must determine both the smoothing method and the periodicity, whereby a simple moving average (arithmetic average) and a period length between 5 and 30 days have prevailed with regard to the former. But of course the ATR is not limited to this choice. Picture 3 shows the ATR with the default setting selected by Guidants over 14 candles.
Here is a free demo of the Guidants trading platform.

Application areas of the Average True Range
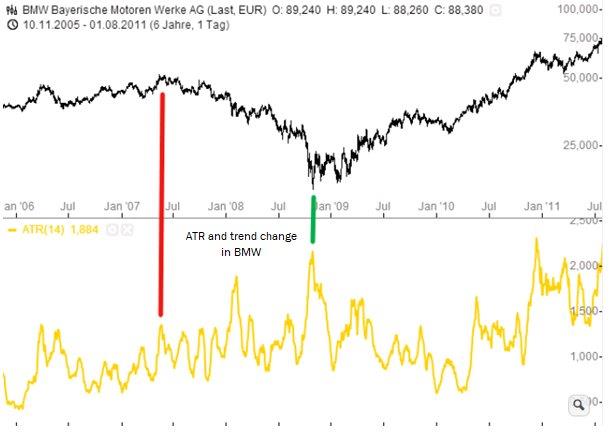
The ATR shows us the true trading range of the considered market and thus its volatility. If the ATR rises, the volatility increases, while a falling ATR indicates a decreasing volatility. This leads directly to the first area of application of the ATR as a prognostic instrument for determining trend strength. Here, the basic assumption is that incipient trends are accompanied by increased volatility, while as the trend progresses, volatility and thus the ATR should decrease. Consequently, if the ATR weakens and decreases to low historical values, which are followed by an "explosion" of the ATR, this could indicate the beginning of a new trend. However, the ATR itself is not able to determine the trend direction. This must be done via other concepts.
Already at this point a personal remark is allowed. I am quite sceptical against this often encountered interpretation of the ATR. Although the assumption behind this theory, that the dynamics of the movements should exhaust itself with advancing trend, because increasingly more market participants already invested in the value and/or fled from it, sounds logical, but is the stock exchange logical?
What about classic speculative bubbles in which price movements accelerate massively, especially towards the end of the trend? What about the phenomenon, also often observed, that prices usually fall faster than they rise, and the associated sell-offs? If we just look at the example of BMW with its major trend reversals of recent years (see Pic. 4), this is a good example of the failure of the above statement. Neither the start of the bear market in 2007 nor that of the bull market in 2009 was indicated by conspicuously small ATR values at the respective highs and lows, on the contrary. This would even allow a completely inverse statement in the reverse conclusion, which however would have to be checked empirically.
More exciting seems to be the forecasting benefit of the ATR to estimate the fluctuations and thus the trading ranges of future candles. A simple assumption would be, for example, that the next candle should follow the previous average of the ATR within its trading range and prices outside of these ranges are rather unlikely. Based on the currently known closing price, the corresponding ATR values could now be deducted up and down to determine the "maximum" price limits for the next candle.
Intraday trader will use the daily chart for this purpose, make their calculations there and thus get the corresponding ATR-based supports and resistances for the next day. Longer-term oriented traders and investors fall back on correspondingly larger intervals like the weekly or monthly chart. Picture 5 illustrates this approach using the DAX daily chart as an example.
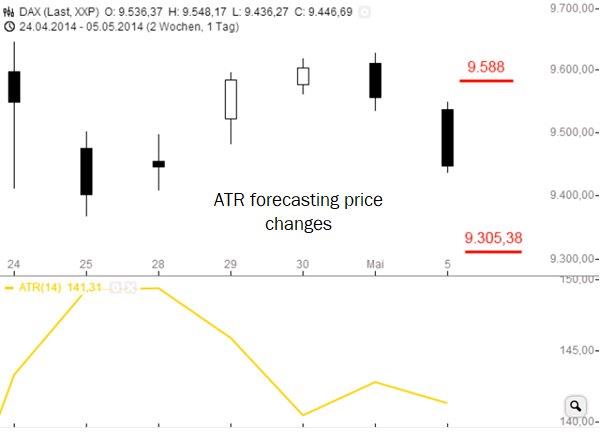
Here, the ATR(14) for the DAX shows a value of 141.31 points, while the closing price is at 9,446.69 points. If we add the ATR to this value, an upper resistance for the next candle at 9.588 points would result, while a deduction of the ATR from the closing price would yield a support at 9.305,38 points. Following our assumption, the next candle should move within this price range and prices outside are unlikely.
This concept could be further refined, e.g. by considering the current trend of the ATR (rising/falling) or by using multiples of the ATR. In these multiples the standard deviation of the ATR-values could be included as well as other continuative approaches. The "imagination" of the trader has no limits in order to fully exploit the statistical possibilities to estimate future ranges of fluctuation and thus also the potential of movements.
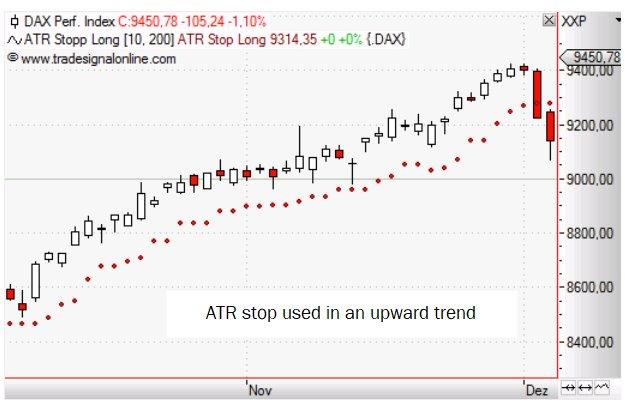
A further application possibility lies in the stop setting with the help of the ATR. The ATR reflects the normal fluctuation range of the considered market and under this assumption it seems obvious to place stops outside of it - especially when the trader wants to ride a trend. In this case the trader does not want to be thrown out of his position by the noise in the market and the ATR allows a quantitative determination of this noise. In this sense, the trader uses a multiple of the ATR to hedge his position via initial stoploss and trailing stop.
The recommendation of a triple ATR is common in this area in order to give the underlying asset enough room. This might be a good starting point for the own trading, however the value could surely be refined by corresponding research. Each market has its own characteristics, so that general recommendations are to be enjoyed in principle with caution. Just play around with different ATR multiples to get optimized values for you and your trading.
Regardless of which multiple the trader chooses, the stop concepts using ATR have some things in common. Firstly, the stop in volatile markets or market phases will be further away from the entry price than in quiet phases. Furthermore, the trailing stop is only adjusted if the market moves in the desired direction. Again, it will be adjusted more moderately if the market is volatile, while decreasing volatility will result in the stop-loss being drawn closer to the current price (see Figure 6). Of course, this approach also provides some interesting additional ideas. For example, the ATR multiples for our stops could be varied over time depending on the trend stage or the ATR's own standard deviation (dynamic ATR multiples).
Finally, it should be mentioned that the ATR is included in a number of other indicators, especially price bands. For example, the width of the Keltner channel is determined by the ATR (see Fig. 7). As a measure of volatility in the market, it can also be used within Risk & Money Management to quantify risks or to determine position sizes appropriate to the current volatility.
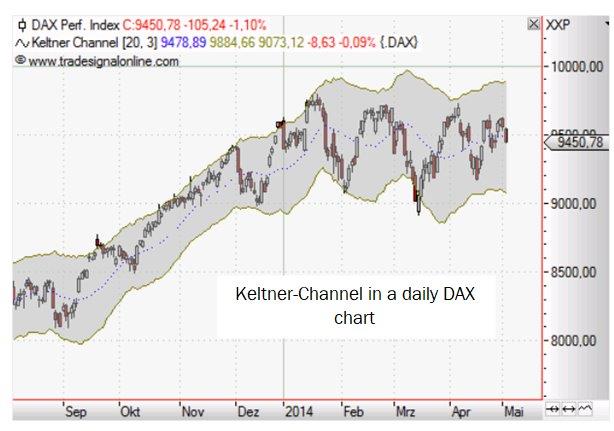
Chart was created with Tradesignal, Tradesignal® is a registered trademark of Tradesignal GmbH. Unauthorized use or misuse is expressly prohibited.
Critical appraisal of ATR
The ATR is a very powerful tool within trading. Starting with the prognostic character up to the concrete component as a stoploss within a trading strategy, there are a lot of possible applications. It makes sense to leave the beaten track within the ATR concept and to make your own empirical investigations and gain experience. I wish you much success.
Discover chart formations on the award-winning NanoTrader platform.

"The NanoTrader platform is magnificent." – Kai
"NanoTrader is my fourth trading platform and it is by far the BEST platform." – Henry
"I have already familiarized myself a little bit with the platform and I can tell you, that it is the best trading platform I have ever used." – Peter