
Indicators are part of the tools of technical analysis. Above all, traders should examine whether these are synchronous with the price or not. If divergences occur, they can generate valuable entry signals. Indicators are calculated from the price trend of the respective value. The inclusion of past quotations results in a certain delay. This is why most indicators follow prices. Only very few indicators have properties that
can be described
as leading. One of them is the so-called divergence.
Divergences occur when the course of the price and the indicator take different directions. Divergences can be observed in oscillators such as the Relative Strength Indicator (RSI), Moving Average Convergence/Divergence (MACD)*, Commodity Channel Index (CCI) and Stochastic. In fact, these indicators give their best signals when they deviate from the price and thus build up divergences.

"Thank you for the detailed explanation. WHS really has the BEST service." – Stanisław
"Thank you very much for the super fast reply. The best service, absolutely TOP!!!" – Marcel
"Once again, thank you for the excellent service. Since many years I am very satisfied with WHS' performance." – Majid
The most common is the classic or normal divergence, which is a reversal pattern. This is a deviation between the price and the indicator that can announce a short-term or medium-term trend change. Two points are essential to define a classic divergence:
The price marks higher highs with lower oscillator highs at the same time. This announces a change from an uptrend to a downtrend and is referred to as "bearish divergence".
The price marks deeper lows, while the indicator simultaneously reaches higher lows. This scenario announces a reversal from down to up trend and is called "bullish divergence".
The classic divergence thus indicates that the momentum underlying the movement may be weakening and a high or low may be imminent. Classical divergence can, however, again be divided into three types.
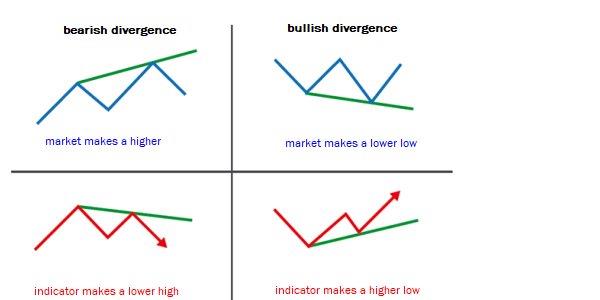
DIVERGENCE (CLASS A)
Class A divergences are the most meaningful and lead to the best trading signals. They usually indicate a sharp and sustained trend reversal. The definition is as follows:
- A Class A bearish divergence occurs when the price marks a new high and the indicator marks a lower high (Figure 1). For identification it is important that the second (lower) high of the indicator does not have enough momentum to break its previous high. This gives a strong indication that the price momentum is shifting.
- Class A bullish divergence occurs when the price marks new lows but the oscillator generates a higher low. It is important that the second (higher) low does not have enough momentum to fall below its previous low. This also gives a strong indication of a shift in momentum.
Image 1. Divergence class A. Image 1 shows a schematic representation of a class A bearish and bullish divergence. The upper part of the picture shows the corresponding course and the lower part the course of the corresponding oscillator.

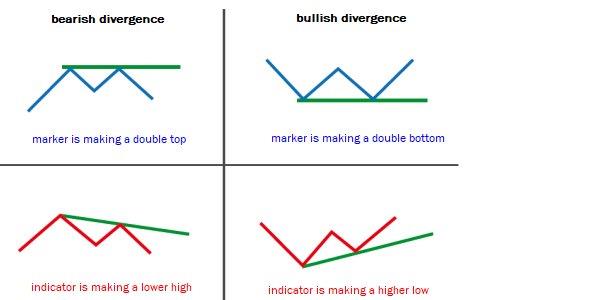
DIVERGENCE (CLASS B)
Although this type of divergence arises with sufficient momentum, it is advisable to have it confirmed by another indicator before using it as a trigger for an entry. It is a weaker type of divergence that signals a gradual trend reversal.
- A class B bearish divergence occurs when the price shows a double top while the indicator already marks a lower low (Figure 2). This means that the price may still have some momentum to continue the previous trend. The double top can be called the equilibrium moment where bulls and bears balance each other out.
- A Class B bullish divergence occurs conversely when the price forms a double bottom or a W formation and the indicator simultaneously generates higher lows. Here, too, there is a moment of equilibrium which makes the signal appear somewhat uncertain.
Image 2. Divergence class B. Image 2 shows a schematic representation of the two Class B divergences. These are only partially suitable as a template for a trading setup.
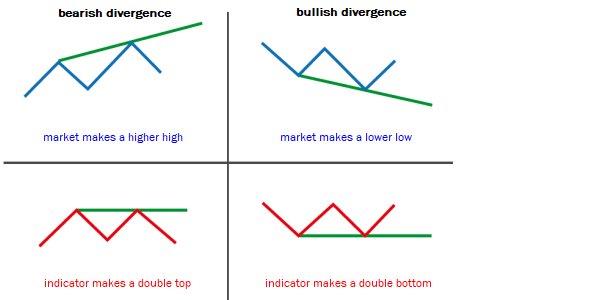
DIVERGENCE AND HIDDEN DIVERGENCE (CLASS C)
Class C divergence is the weakest form of this signal, particularly in turbulent market phases. It is not suitable as a basis for trading setups. In order to be able to exclude this type of divergence safely, you should nevertheless know how it is defined.
- A class C bearish divergence occurs when the price marks new highs and the indicator cannot confirm the new high by staying in the range of the previous highs (Figure 3). This means that this time the indicator shows the double top and therefore the underlying loss of momentum is not strong.
- A Class C bullish divergence occurs when the price marks new lower lows but the indicator does not fall below the previous low. It thus forms a double bottom. Here, too, the loss of momentum that can be observed is not large.
Image 3. Divergence class C. This type of divergence provides the weakest signals and should therefore not be used for a trading setup. The indicator shows a double bottom or a double top. This indicates that the underlying loss of momentum is not high.
HIDDEN DIVERGENCE
An effective variant is hidden divergence. It is also a deviation between price and indicator, but is a continuation pattern. It is defined as follows:
- A bearish hidden divergence means a lower high of the price and a higher high of the indicator and serves as confirmation of the downward trend.
- A bullish hidden divergence is shown by higher lows of the price and lower lows of the oscillator. It is a confirmation of the upward price trend.
Image 4. Example of a hidden divergence. Image 4 shows an example of a bullish hidden divergence. The Visa share built up this divergence between autumn 2015 and early 2016 and then continued its upward trend for months.
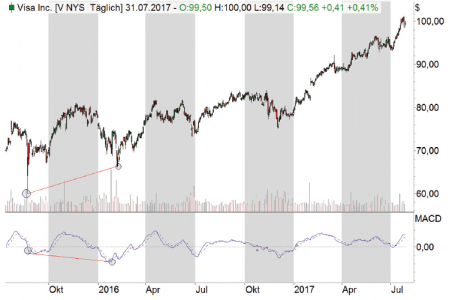
The Visa share provided a good example of hidden bullish divergence. In February 2016, the price marked the necessary higher low, while the MACD formed a lower low. The difference to the Class A divergence was that the price should form a lower low and the indicator a higher low.
TRADING DIVERGENCES AND PLANNING THE TRADE
In order to trade divergences, traders need a concrete entry scenario and risk management as well as a fixed exit. So you should build a trading plan around the setup of a classic divergence and then consistently follow it up.
The catch is that you should only trade after confirmation. With this setup, it could also be that it is initially only a small setback within an existing trend. A series of divergences could arise before the turnaround really comes. But that would only mean that the price would take air for the turnaround. So you should add another indicator to the entry trigger: the Bollinger Bands. You can use these to assess volatility. This is important because divergence is preceded by a change in volatility. In their basic form, the Bollinger Bands provide an indication of whether the price is oversold or overbought. This makes them ideal for predicting trend reversals.


The Bollinger Band divergence occurs when the price forms a reversal pattern and the Bollinger Bands offer support or resistance after a classic divergence has formed. Specifically, a bullish Bollinger band divergence occurs when a classic divergence has formed, there is a reversal candle outside the lower band and the next candle then closes again inside the band. The lower band then becomes a support for the price. This happens at the critical point of momentum change and is therefore the confirmation factor we are looking for. So if a normal divergence has been identified on the oscillator, we are looking for confirmation of a divergence on the Bollinger Bands.
So the rules for a bullish divergence are as follows (for a bearish divergence vice versa):
Setup: classic divergence exists
Identification of the setup: combination of oscillator (e.g. slow stochastics) and the Bollinger bands
Entry: price forms reversal pattern at lower band; lower Bollinger band becomes support band
Stop: below the lowest low of the candle forming the divergence; if the price forms a lower low again until the entry signal through the Bollinger bands, then below it
Exit: when the price reaches the upper band or forms a bearish divergence at the upper band, indicating a loss of momentum.
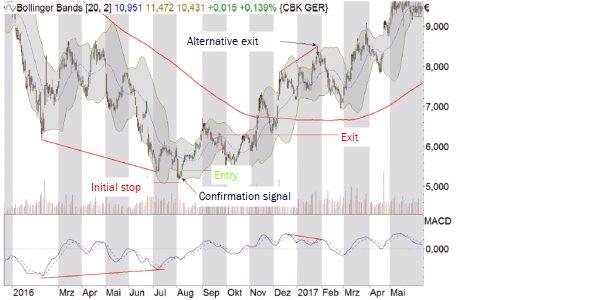
TRADING EXAMPLE COMMERZBANK
Image 5 shows an example of a classical divergence on the Bollinger band. On February 10, 2016, the Commerzbank share hit a temporary low after a steep crash - as did the MACD. After a laborious countermove, the share marked a new lower low at the beginning of July of the same year - but the MACD a higher one. It took almost another whole month for confirmation of the trend reversal to come from the Bollinger bands with the breakout downwards and the rapid return to these bands. According to this strategy, one could have entered on August 5 at the closing price of 5.40 euros, with an initial stop price of 5.10 euros (since the low at the breakthrough through the lower band was 5.16 euros). For the exit two variants were mentioned in the setup. The first would come into force when reaching the upper band. The Commerzbank share had reached this target on August 31, 2016, at a closing price of EUR 6.31. The share price was trading at the end of the first quarter of 2016. In this scenario, the profit would have been 16.9 percent with an initial risk of 5.6 percent.
The second option would be to opt out if a bearish divergence formed. This was much later, on January 26, 2017, when the price formed a higher high and the MACD a lower high. The exit at the closing price here would have been at 8.33 euros and the gain would have been much higher at 54.3 percent. But you would have had to endure massive fluctuations during this period. After the price target from variant one had been reached, the position even went slightly down again - but not below the initial stop price - only to then go strongly up again. You first have to endure so much volatility. In addition, the capital would have been tied up for much longer. Which variant you choose for the exit therefore depends on which type of trader you are.
Image 5. At the beginning of August 2016, Commerzbank provided the conditions for the trading setup for trading a bullish Class A divergence: The price formed a lower low, but the MACD a higher one. One month later, the price broke out of the lower Bollinger band and returned quickly - our entry signal (green line). The trading plan set out two different exit strategies that would have led to very different results, but also to very different volatilities.
TRADING THE HIDDEN DIVERGENCE
In the case of a bullish hidden divergence, we first define the two divergence candles (the inverse candles of the higher low) that cause the deeper low of the oscillator. We place our entry order over the high of the second reversing candle (the second candle that has the higher high) and our stop under the low of the same candle. We leave the trade when the stochastic has reached the overbought level and the stochastic lines have crossed in a downward direction. In a bearish hidden divergence, the rules work the other way around.
TRADING EXAMPLE OF HIDDEN DIVERGENCE
An example of a hidden divergence was provided by the Apple share (Fig. 6). In September 2016, it marked an interim low. The price then rose steeply and, following the subsequent consolidation on 14 November 2016, marked a new interim low that was higher than the first. At the same time, the MACD marked a new interim low on 14 November, which was lower than the September low: a hidden divergence.
Image 6. Trading example of a hidden divergence. Apple provided a good example of the bullish version of a hidden divergence in late 2016: the price formed a higher low, while the MACD marked a lower low. Overcoming the daily high of November 14th was our long signal. For the exit we used the slow stochastic as it turned in the overbought area and the stochastic lines crossed.
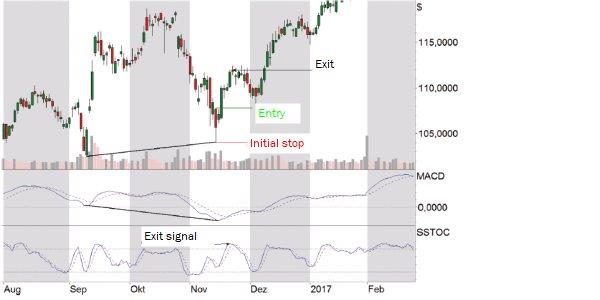
Accordingly, a long signal was given on November 16th at 107.81 US dollars after the daily high of November 14 was breached. According to the trading plan, the initial stop would have been at 104.05 US dollars and thus below the daily low of 104.08 US dollars on 14th November. It is advisable to always go a few cents below the low in order to avoid being stopped unnecessarily if the price falls slightly below it during the level test. According to Setup, the exit followed as the slow stochastic indicator turned in the overbought territory and the stochastic lines crossed. That would have been the case in this example on November 22, 2016. The exit could have taken place on that day at the closing price of 111.80 US dollars.
BOTTOM LINE
Both normal and hidden divergences occur quite frequently in all time frames. The goal was to create a strategy that encompasses all aspects of a trade and leaves no room for emotion. Traders must have the patience to wait for a divergence pattern to emerge - and the discipline to enter trades only in divergence setups. Source: Traders' Mag.
FREE trading webinars in German, French and Dutch...

"I can only recommend that every trader joins this seminar." – Peter
"This webinar was SUPER." – Nicolas
"For myself, and the people sitting around me, this was the best presentation we have ever seen on the topic of trading systems and indicators." – Wilfrid