
The inverse version of a triangle formation can initiate swing trades and helps to profit from false breakouts and enter price movements early. Trading would be so easy if uptrends would always consist of rising support and resistance points and downtrends would always consist of their falling counterparts.
Sometimes trends are actually like that. They allow the trader to simply place a trailing stop below the previous low and then pull it higher and higher to secure a long position.
But...that rarely happens. Unfortunately the markets have the habit of forming resistances over which they first rise (this is where traders enter), and then fall below them again (this is where these traders are stopped out of their long trades), only to rally again - but then without these traders.
There is, however, a formation - the widening triangle - with which one can take advantage of these situations. The broadening triangle is practically the mirror image of a normal triangle. Instead of consolidation running into an ever narrower span, the broadening triangle consists of ever larger sweeps, so that finally the shape of a megaphone is formed (Pic. 1).
Try formation trading like the widening triangle on the award-winning NanoTrader platform.

"The NanoTrader platform is magnificent." – Kai
"NanoTrader is my fourth trading platform and it is by far the BEST platform." – Henry
"I have already familiarized myself a little bit with the platform and I can tell you, that it is the best trading platform I have ever used." – Peter
Picture 1: Widening triangles
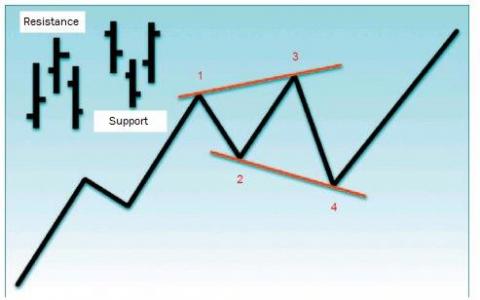
Picture 1: Expanding triangles consist of a series of larger and larger swings. The support and resistance levels are determined by four pivot points.
The formation begins in an upward trend at point 1, the first high or resistance level. From here the market falls to point 2, a support level. Next, the market makes a new high at point 3. Now the market cannot hold above point 1, it turns accordingly and even falls below point 2, forming the lower support level at point 4.
The support and resistance points each consist of three bars and are usually called pivot highs / lows or isolated highs / lows. This price behavior can be very frustrating for traders trying to break above point 1 long or below point 2 short. However, if the uptrend is still intact, there is a high probability that the market will make new highs. Therefore, it is possible to go long in anticipation of another upward swing when the market has formed point 4 and is trading above point 2 again. This approach offers the opportunity to enter the trade earlier at the pivot low instead of waiting for the breakout.
Longtrade
Taking trades in the direction of the longer-term trend is the first criterion of this approach. The trend can be set in a variety of ways; to illustrate it here, we will simply use a 50-day average. If the market moves above this average, we consider the trend to be up and go long after point 4 has formed. If the market is below the 50-day moving average, we look for short positions after a counter-center rally has formed up to point 4.
In Picture 2, the 50-day average rises and the price is above the average. So we look for a long opportunity. Points 1, 2 and 3 form, then the price falls back below point 2 and forms point 4.
Picture 2: Long Trade
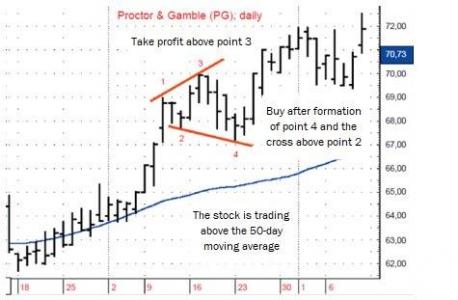
Picture 2: A long trade setup is formed when the stock is trading above the low of point 2 again after the new low at pivot 4. Profits are partially or completely taken away if it goes above pivot point 3. The trade is based on the existence of a longer-term upward trend, which is represented here by a 50-day average.
Once the market trades below the support level at pivot point 2, one can go long the next day if there is a movement beyond pivot point 2. You can stay long until point 4 is taken out. However, the safest technique is to wait until the closing price is above point 2. The stop loss is placed a little below the low at point 4, and the position is partially or fully closed when the market finally skips the high at 3. Note that a trader who usually trades pullbacks would probably go long at the moment the market rises above point 3, after the setback in which point 4 developed. Although the stock in this example moved further up than to point 3, the movement between points 4 and 3 accounted for much of the overall movement, which finally ended in early August.
Trade triangle formations in the NanoTrader platform, which has won numerous awards.

Test WH SelfInvest, download a free demo.
Shorttrade
In picture 3, the 50-day average falls and the share trades below the average. There is the possibility of a short trade. Point 3 is below point 1, point 4 is above point 2, the share slightly violates the moving average. But that is not a problem, because the average is a resistance (also note that the stock closed below the average). You can go short if the price moves below point 2, but the safest entry technique is to enter at the closing price of the bar after point 4. You then place the stop slightly above point 4 and take profits when reaching point 3 or below.
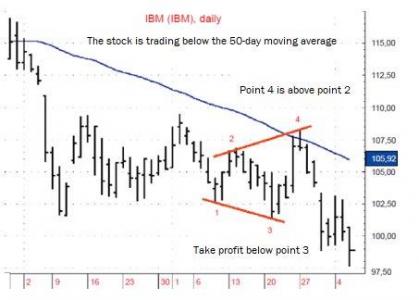
Picture 3: Short trades are initiated by practically reversing the rules for long trades. To control the risk, a stop is placed here above point 4.
More than 100 indicators are available in the NanoTrader with one click as well as more than 60 ready-to-use strategies for direct use. You can test them free of charge now.