The regular ups and downs at the markets can become a real test for the nerves of many traders. Whether a position is currently held or the market is only observed - the back and forth regularly leaves plenty of room for personal interpretation. Although a trend in the market is often recognizable, there are always phases in which false signals can mislead a trader and he runs the risk of prematurely taking a position or dissolving it. In these moments it is difficult to stay calm and keep track.
Heikin-Ashi: A variation of the Candlesticks
Heikin Ashi candles, like classic candlesticks, have their origin in Japan. They have been known there for more than 100 years and were only made available to the western trading community by Dan Valcu in 2004. Since then they have had a firm place in the trading community, but neither in literature nor in consistent implementation has this form of representation been able to assert itself so far. Wrongly, as you will see in a moment. Anyone who has ever watched the price events during a trading session more closely will have noticed that the price of a security, a foreign exchange or an index does not run constantly in one direction. Ideally, there is a certain tendency, but this is regularly broken by large and small backsets, trend confirmations and counter signals. These arise during a trading session through the interaction of the various market participants, who all try in some way to use the price of a security to their advantage. This can lead to disturbances and background noises which, although they have no direct influence on the basic trend, regularly complicate the interpretation of a chart. The shorter the time unit under consideration, the greater the significance of these disturbances. These background noises can result in false signals that lure a committed trader onto the wrong track and thus either throw him out of a position or pull him in. A chart with Heikin Ashi candles, on the other hand, shows a much more relaxed and constructive picture. But what are Heikin Ashi candles actually based on? How are they structured to show such a calm trend?
Structure of the Heikin Ashi candles
While classical candlesticks are structured in such a way that they contain the high, low, opening and closing prices of the period in question and show in color whether the closing price was below or above the opening price, Heikin Ashi candles have a different structure. Compared to "normal" candles, not only the considered period is included, but also the previous one. This means in detail:
The opening price is calculated from the average of the opening and closing prices of the previous period:

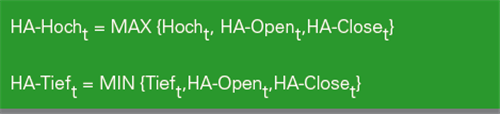
The closing price of a Heikin Ashi candle consists of the average of the opening price, absolute closing price, low and high of the period:

The highs and lows are the absolute highs and lows of the period under consideration, including the Heikin Ashi opening and closing prices. The price that forms the maximum applies:
So we see that the Heikin Ashi candles represent both a reference to the current period (t) and to the previous period (t-1). This has decisive advantages for our consideration. By including the previous period and averaging based on it, the consideration of movements is smoothed out on the one hand, and on the other hand extreme movements such as price gaps are taken out of consideration. As a result, the optical image is easier to perceive and the interpretation becomes correspondingly easier and clearer. Simple and quick interpretation While candle charts offer a variety of interpretation possibilities, such as in the single candle itself or in the formation of several candles, Heikin Ashi candles do not offer such interpretation possibilities. You will not be able to identify a hammer or a reversal pattern like a Morning Star with Heikin Ashi candles. With candlesticks, a hammer can be a nice starting signal as an unambiguous signal, with which a trader creates a prompt entry into a beginning upward movement. The same applies to the Morning Star. Both signals often indicate a trend change or a return to the trend after a correction. Nevertheless, there is room for misinterpretation. With Heikin Ashi candles you can mitigate this danger of misinterpretation. A clear signal for a trend change here is always a color change. But Heikin Ashi candles can do even more. In fact, they help us to judge a trend more clearly than we can with classic candlesticks.
Image 1: Variants of Heikin Ashi candles
Image 1 shows how to determine a trend with Heikin Ashi candles.

The length of the candle body also provides information about the trend strength. The further away the closing price is from the opening price, the stronger the trend is. This time we can actually talk about a trend and not just about the strength of a period like when looking at a candlestick chart, because in a Heikin Ashi candle chart we always also look at the previous period. This shows a significant strength of Heikin Ashi candles compared to classic candlesticks. In essence, this means that the Heikin Ashi candles become longer with increasing trend strength and shorter with increasing trend weakness. It should also be noted that the bodies of Heikin Ashi candles become smaller with decreasing trend strength and the upper and lower shadows become longer. This candle shape accompanies us in the Heikin Ashi candle chart also by consolidations or sideways phases. Small candle bodies with upper and lower shadows allow further interpretation. If you observe such a Heikin Ashi candle at the end of a trend, you can expect a trend change or a counter movement. This is especially true if you include other indicators or chart technical elements in the analysis.
Combination with classical chart technique
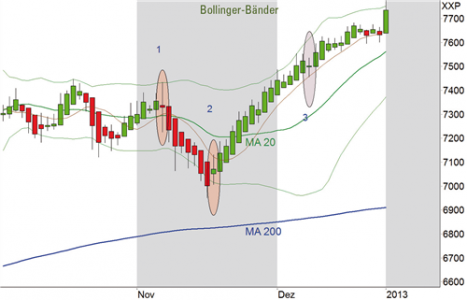
If you observe a Heikin Ashi candle with a small body and long wicks, for example, on a Moving Average, then there is a probability that the course will turn at this point. The probability of a turn is even higher if the Heikin Ashi candle has a different color than the one of the previous period. An entry by stop order can then be a good way to enter the beginning trend. You can make this observation regularly at relevant supports and resistances. In addition, trend channels and Bollinger bands are suitable for such an observation.
The ultimate instrument of chart technical analysis?
Heikin Ashi candles allow the trader to easily determine trends and generate relevant reversal signals without being misled by misinterpretations. The observation of a value can be carried out faster overall and a position once entered can be kept simpler if you orient yourself exclusively to the colors. The large and small false signals, which are known from classic candlestick charts, are filtered by the Heikin Ashi candles and are omitted from this observation. This is also an important component from a psychological point of view, because it is precisely in these uncertain moments, when traders cannot assess in which direction the market tends, that they run the risk of entering the field of tension of fear and greed and their objective market analysis gives way to a subjective view. This inevitably raises the question of why Heikin Ashi candle charts have not long since established themselves as the standard view and have replaced the multitude of presentation options, indicators, oscillators, interpretation and analysis options.
Despite all the enthusiasm about the simplicity of the approach, you must be aware that Heikin Ashi candles, unlike classic candlesticks, are among the indicators. This is due to the construction of Heikin Ashi candles, in which the current and previous periods are always considered. This results in a smoothing of the prices, which is reflected in the presentation.
Last but not least, let's ask ourselves what effect it has on trading if you base your trading decisions on Heikin Ashi candles. This smoothing of the consideration - the indicator property - results in the fact that the Heikin Ashi candles only allow a subsequent consideration, at most a snapshot. Due to the lack of interpretation possibilities such as formations or candlesticks, no forecasts can be made for the following periods. In practice, this means that due to the indicator properties of Heikin Ashi candles, you regularly receive entry and exit signals with a time delay.
If you look at a classic candlestick chart, where for example you recognize a hammer as an entry signal and then set the view to Heikin Ashi candles, you can see that there is still no sign of a trend reversal here. When the hammer is exceeded in the following period on the candlestick chart, the reverse signal is formed on the Heikin Ashi candle chart either as a color change or in the form of a candle with a small body and long upper and lower shadows. The signaling via Heikin Ashi candles is therefore regularly delayed by at least one period.
How can we now act on this signal from a candle with a small body and long upper and lower shadows? In practice, a stop buy entry for a long trade and a stop sell entry for a short trade has proven successful. Then you will only enter the market in the following period and thus clearly after a signal from the classic candlestick chart. In return, however, you get more security by eliminating false signals and background noises. In concrete terms, this means that you enter into fewer trades and therefore have the chance of a higher hit rate.
Bottom line
So the Heikin Ashi Candle Charts are not the ultimate trading instrument. Nevertheless, it is worthwhile to look at the markets with Heikin Ashi Candle Charts, as they allow you to see the state of the markets at a glance. The advantage of Heikin Ashi candles lies in the filter function against false signals and background noises and thus in a clear trend display. The - at least partly - disadvantage lies in the delayed display compared to candle shapes. Nevertheless, it is very well possible to act according to Heikin Ashi candles if you align your risk and money management accordingly and combine the view with other chart technical elements.
Author:
Diplom-Volkswirt Wieland Arlt is a trained and certified coach and trainer. For several years he has been actively acting on short-term time levels.
Source: TRADERS' Mag.