
A failed chart formation doesn't need be the end of the trade. It can be the beginning of a new fantastic trade if you know what to look for.
Discover chart formations on the award-winning NanoTrader platform.

"The NanoTrader platform is magnificent." – Kai
"NanoTrader is my fourth trading platform and it is by far the BEST platform." – Henry
"I have already familiarized myself a little bit with the platform and I can tell you, that it is the best trading platform I have ever used." – Peter
You probably know the saying "When life gives you lemons, make lemonade". When the market gives you lemons (a normally trustworthy chart formation suddenly stops working), how can you make delicious cool lemonade (a profitable trade) out of it? The answer is one of the most consistent and profitable characteristics of the market: when a normally trustworthy chart formation fails, the market usually makes a significant move in the opposite direction. The false signal is even more reliable than the original signal.
To demonstrate this, we look at the false signals of a simple chart formation - the Inside Day / Narrow Range 4 formation.

The ID/NR4 Formation
The Inside Day / Narrow Range 4 Pattern (ID/NR4) is known to compensate for false signals by producing violent movements in the opposite direction. Picture1 illustrates the formation. An inside day is a price bar that does not reach the previous day's high or low; in other words, its high is lower than the previous day's high, its low is higher than the previous day's low. A Narrow Range 4 Day is virtually a price bar that has the smallest range (the high minus the low) of the last four days. An Inside Day with the narrowest range of the last four days is a useful formation because it shows relatively low volatility (relative to the last price movements), which should be followed by a breakout in one direction or the other as volatility increases. A typical trade would be to buy when prices go above the high of the formation and sell when they trade below.
Picture 1: The ID/NR4 formation
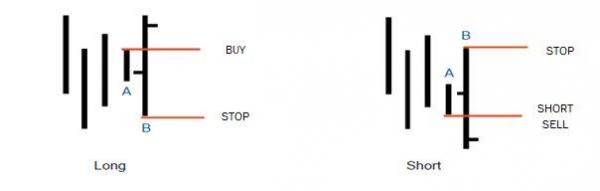
Picture 1: Long (left): Bar A is an inside day with the smallest span of the last four days (ID/NR4). Bar B trades below the low of Bar A, and thus provides a buying opportunity when prices subsequently move above the high of Bar A. Short (right): Bar A is an ID/NR4. Bar B first towers above the high of Bar A, and you sell short when prices trade below the low of Bar A.
ID/NR4 fails
It is even more trustworthy than the original formation if the ID/NR4 formation fails. If prices go above the ID/NR4 formation, but then turn the same day and fall below the low of the formation again, the downward movement usually continues. The same is true the other way around, of course, and can then be used as a short setup. The strategy for trading this formation is called Inside Out, because the first bar of the formation is an Inside Day, whereas the second bar is an Outside Day (a bar with high and low respectively above and below the previous day).
The rules for trading the Inside Out strategy are as follows:
Long trade.
Setup (tells you that a favorable formation could be forming now):Yesterday was an ID/NR4 formation.
Entry: If the price falls below yesterday's low, place an order to buy above yesterday's high.
Exit:
- When the order is executed, you place a stop below the current intraday low (the previous low of the day).
- Make a one-bar stop (get out on the first bar that goes below the low of the previous bar).
Short Trade
Setup: Yesterday was an ID/NR4 formation.
Entry: If the price rises above yesterday's high, place an order to sell below yesterday's low.
Exit:
- When the order is executed, you place a stop above yesterday's intraday high.
- Place a one-bar stop.
Picture 2: LongTrade
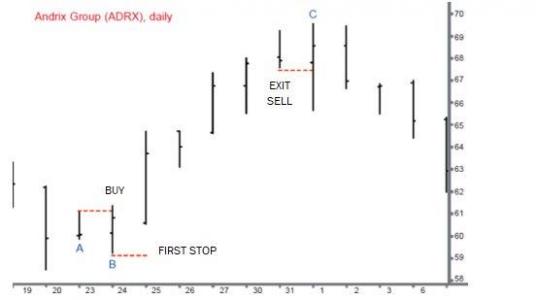
Picture 2: Prices rise for five days after the Inside Out buy signal. A trailing stop below the low of the last day follows the trade until it is finally stopped with profit.
Picture 3: Intraday confirmation

Picture 3: A 30-min chart of picture 2 shows that prices dived below the ID/NR4 low before rising above the ID/NR4 high.
Inside out trades
In picture 2, bar B hitsthe low of bar A (an ID/NR4), so we place a buy order above the high of A. When the order was executed (at 61.15), we place the first stop below the current intraday low. For each subsequent day, we always place the stop below the previous day's low. We are stopped at bar C at 67.50. The risk of the trade was 2.0 and the profit was 6.35. This results in a respectable Risk-Reward Ratio of 3.18 to 1.
Picture 3 shows that it was almost certain that bar B would fall below the low of bar A before rising above the high of bar A. This was because the open of bar B was closer to the low than the high of bar A. However, it is almost impossible to see this unless you look at the intraday data. The 30-min chart (picture 3) shows the previous day's high and low as A and B. This is practically the day before bar A in picture 2.
The next day's high and low (C and D) are within the range of that day. This is the Inside Day. Points E and F mark the day of entry with the fall below the previous day's low and the subsequent rise above the previous day's high. In picture 4, Bar B first passes above the high of Bar A (an ID/NR4), allowing you to place a short sell order at the low of Bar A (at 44.10). When the sell order is executed, we set our stop at the intraday high. On each subsequent day, we now move the stop to the previous day's high until we finally stop at C at 35.8. The risk of the trade was 1.29, the profit was 8.30. This gives a profit/loss ratio of 6.4 to 1. To see that this example really qualified as an Inside Out trade, we check the Intraday chart. The 30-min Chart (picture 5) shows highs and lows with A and B, followed by the Inside Day with C and D, since the complete price movement was within A and B. At point E the prices briefly hits the high of the inside day, only to turn around and fall below the low afterwards. At bar F, short is taken, just below the low of D. The intraday chart shows that the rise above the high of the inside day occurred before the breakout to the bottom. So we have a valid example of an Inside Out Trade.
Picture 4: Short Trade
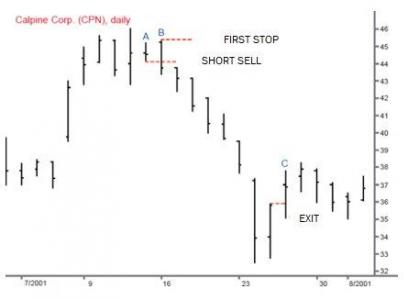
Picture 4: Six days of lower lows and lower highs followed the Inside Out sell signal. A trailing stop above the last high secured the profits until the profitable exit.
Picture 5: Intraday Reversal

Picture 5: A 30-min chart of picture 2 shows that prices went below the ID/NR4 low before rising above the ID/NR4 high.
Intraday examples
The ID/NR4 formation also works intraday. Picture 6 shows an Inside Out Trade in IBM on a 30-min Chart. Bar B falls below the low of Bar A (the ID/NR4 formation), so we can place a buy order above the high of A. (Note that for intraday trades, the original stops can be placed much closer to the entry price, as an intraday spread always represents a smaller amount than a daily spread). When the buy order was executed, a trailing stop was used below each of the 30-minute lows. The trade was stopped at C the next day. We bought at 103.97 and sold at 106.17. The risk of the trade was 0.32, giving a fantastic risk/reward ratio of 6.88 to 1. The last Inside Out example (Figure 7) occurred in a 15-minute chart. Bar B went above the high of Bar A (an ID/NR4 formation), we placed a sell order below the low of Bar A. When the sell order was executed, the first stop was set at the high of Bar A, and over time trailing stops were used at the highs of the intraday bars. We sold short at 28.52 and were stopped at 26.87. The risk was 0.24 and the profit was 1.65. This again results in an exceptionally high risk/reward ratio of 6.88 to 1.
Picture 6: Intraday buy
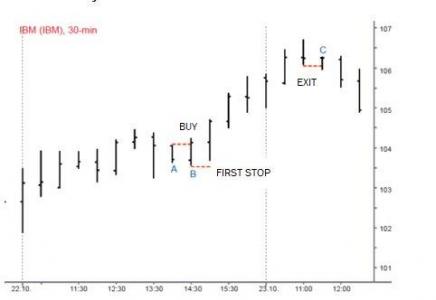
Picture 6: Here the Inside Out Trade occurred in a 30-min Chart. The 5-min chart (not shown here) confirms that IBM was trading below the low before the high was taken out.
Picture 7 Intraday Short Sell
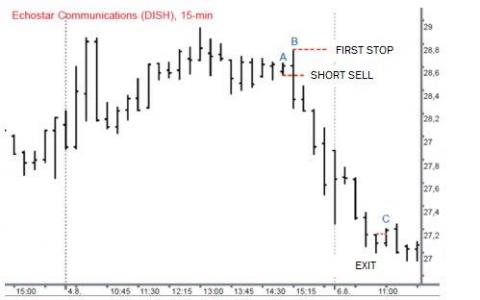
Picture 7: In this example, a 15-minute chart showed the Inside Out selling opportunity: The Trailing Stop was set much tighter than in the examples on a daily basis, as the intraday spreads are smaller.
The reaction to false signals is universal
Benefiting from false signals is not limited to the ID/NR4 formation; most other chart formations also react predictably when the original trade signal is reversed.
To take advantage of these characteristics, many successful traders automatically turn their positions when their original position is stopped. In fact, some professional traders limit all their trading to trading on false signals, only taking positions against the original signal when it is proven to be false. Always bearing in mind that the most trustworthy signal in technical analysis is the false signal, you are definitely prepared to make lemonade when the market is giving out lemons. This is especially true for the ID/NR 4 formation.
