
The beauty of trading is that you can theoretically operate it from anywhere in the world - at your desk, in your living room or in your holiday paradise. Nobody cares whether you sit in a suit and tie in front of the computer or in a jogging or swimming trunk. And the trading platform can be as casual as the screen. Have you ever tried it naked?
Don't worry, naked trading isn't about your outfit, it's about what your chart looks like. Trading beginners in particular often expect a multitude of indicators to give them a head start, which then helps them to trade profitably. Experience shows, however, that this is often a fallacy. Indicators are somewhat advanced. Let us explain how the author arrived at this opinion.
Indicators are for advanced learners
If you look at the nature of most technical indicators, you will see that the calculation of most of them is always based on one and the same variable: price. This is then processed with a wide variety of mathematical formulas and the result is the indicator in its various forms. Thus, the majority of indicators can be defined as mathematical derivatives of the price.
Time-based charts such as the candlestick chart show the price over a certain period of time. Depending on the selected setting, a candle then reflects the price movement within five minutes, one hour, four hours or even whole days. The behavior of the price during this period is also known as price action. Especially as a trading beginner you should concentrate on understanding the price action. Because this is the basis of successful trading. Only when you are able to interpret price movements correctly does it make sense to include additional tools such as indicators in the chart. Because indicators should support you in your trading decision and not just justify it.
Download free e-books ...


Naked Trading
But it also works without it: Trading from the naked chart. The author likes to use the above-mentioned representation of the so-called candlesticks. These have the advantage that the trader has all the information at a glance: the opening, closing, high and low prices. You can also see whether the price has risen, fallen or remained at the same level compared to the previous period. The selected time level is relatively irrelevant for the interpretation of the price action. Whether in small time levels such as five to 15 minutes or in the 1- to 4-hour chart: the method remains the same. But you have to watch out for the position size and risk management when trading later.
However, the analysis itself is relatively simple. The point is to determine whether the market is balanced, i.e. whether it will move sideways, or whether there is buying or selling pressure in the market or whether it could develop in the near future.
The chart provides all the necessary information and you get a clear view of the essentials:
- You can examine individual candles as well as candle combinations.
- You can use the candle length to make statements about trend behavior.
- You can draw conclusions about buying and selling pressure based on the distance between the opening and closing price.
- You can see the mass behavior of investors.
Are they set in a certain direction or are they rather insecure?
The most important instrument in this analysis is the identification of structural levels (see info box). In fact, the identification of those levels and the interpretation of the price action would be sufficient to place a trade. Trading beginners in particular often feel insecure, however, to make a decision on the basis of this analysis alone. Therefore, various patterns have developed in the trading community that are intended to make it easier for beginners to get started.
INFOBOX: Structural Levels Structural levels are areas in which the price attempts to break through a certain price level upwards or downwards. The longer or the more often the price has stayed at or started at this level, the more meaningful it is. If a confirmation of this level is found at a higher time level, the significance of this area increases. If, for example, you identify a structural level in the range of 15 euros on the 5-minute chart, it becomes more important if, for example, you find the same level on the hourly chart.
Broker WH SelfInvest receives another outstanding rating from the German consumer institute.
- Order execution: 5 out of 5 stars. Score: "extremely good".
- Trading platform: 5 out of 5 stars. Score: "extremely good".
- Mobile platforms: 5 out of 5 stars. Score: "extremely good".
- Service quality: 5 out of 5 stars. Score: "extremely good".
- Order possibilities: 5 out of 5 stars. Score: "extremely good".
Test WH SelfInvest: free demo trading account.
The last kiss
The last kiss is a method of trading a breakout from a sideways movement. It is often the case that the trader recognizes the sideways movement but misses the entry into the breakout from it. The last kiss starts here. Frequently, the price returns after a breakout from a sideways movement in order to test the breakout level again (Figure 1).
This knowledge can be transformed into a trading idea. First you identify a sideways movement - analogous to the definition of a trend line. A trend is defined in technical analysis as a sequence of rising highs and rising lows for an uptrend, analogously for a downtrend. Ideally, the rising lows of an uptrend can be followed by a line describing the course and slope of the trend. Frequently, however, prices do not rise or fall significantly and do not show a clear direction. Then there is a sideways trend. The sideways trend line is also drawn according to the above explanations. Make sure that you have at least two support points on both the top and bottom of the movement.
If it helps you, you can visually enhance the sideways movement by drawing in a box (picture 2). If you then leave the box on one side, patience is required. Now you have to wait until the course tests the outbreak level of the box again. Here you search for your entry. The stop should be above or below the last swing point in the box. Alternatively, you can also choose the middle of the box. The first price target is the next structural level in the chart.
Image 1: Scheme: The last kiss
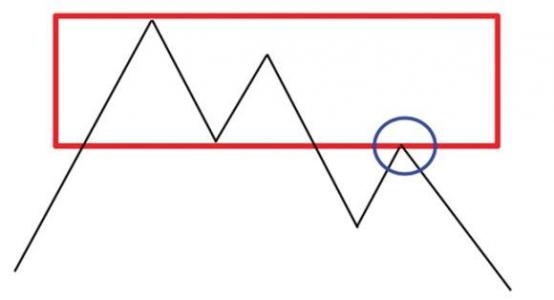
Image1: The scheme shows how the pattern for the short side works (long analog). In a weakening sideways movement, the price breaks out downwards and then tests the lower end of the range again before continuing downwards.

Image 2: Last kiss on EUR/CHF
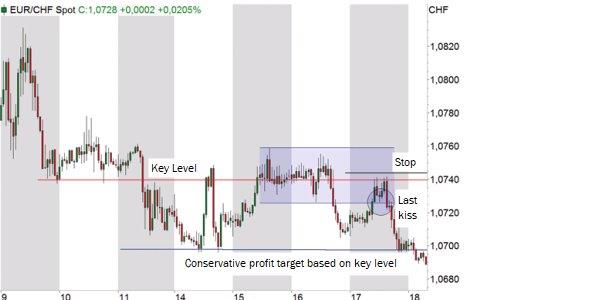
Chart 2: The 1-hour chart shows a weakening sideways movement in a superior downtrend. The price broke down and returned to the blue range before going further down. This is where you look for your entry. For example, the stop (black line) could be in the middle of the range and the profit target (blue line) is set at the next structural level - depending on how conservative you want to trade, a more distant structural level would also be possible.
The Big Hug
The large embrace is a candle formation that traders with deeper knowledge of candle analysis know as engulfing, the embracing pattern. The result is a candle whose candle body completely encloses the previous candle.
There are small differences in the large embrace. The prerequisite for this is a structure level. The shadow of the candle should repel itself from the structure level. It is relatively easy to identify the "shadow candle" because it is a 2-candle formation. The market has to work its way up to a structure level with one or more candles. Then it pushes itself away from this structure level with a large candle. The latter completely encloses the previous candle. The shadow candle should be the largest candle of the last periods (Figure 3).
It is typical for this candle formation that the shadow candle closes close to the high with a bullish expression and close to the low with a bearish expression. The entrance is then quite easy to find. The best method is to enter the market with a stop buy or stop sell order. This is placed briefly above or below the shadow candle. This has the advantage that some false trades can be excluded, where the market turns again in the other direction directly after the shadow candle. It is therefore crucial to wait for the closing price and not to jump into the market prematurely.
The stop is a few points above or below the shadow candle. The price target is found with the help of the next structural level.
Image 3: The big hug at the GBP/USD
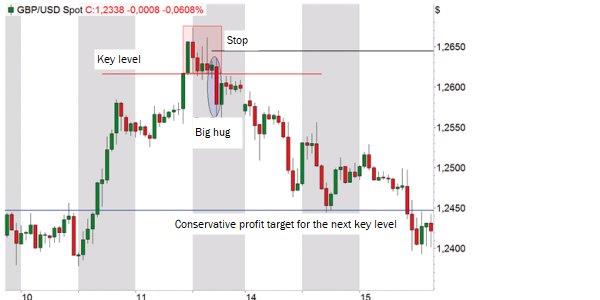
Image 3 shows the big hug on the GBP/USD: a large downward candle on the 1-hour chart exiting the bullish trend and initiating a downward movement (blue oval). The market came from below and tried to breach the 1.2620 level (red rectangle). He did not succeed. The 1-hour chart shows that the market has stayed about five hours above this level, forming a structural level around the 1.2616 level (red line). On the 15-minute chart (not visible) this level becomes even clearer as a kind of double top formation has formed. With the long candle at 16:00 we leave the top sustainably. The entry could take place shortly below the shadow candle. The stop (black line) is a few points above and the profit target (blue line) is at the next structural level.
Variations of Hammer and Hanging Man
The definition according to Steve Nison - who first brought candlestick charts closer to the western world - for a hammer or hanging man is that the shadow has two or three times the size of the candle body. For variation, on the other hand, the definition is only "very long" shadow. In naked trading, there are a few additional rules. So it is necessary that the candle with the long shadow is at a structure level. If you are bullish, the candle must be positive, i.e. the closing price must be above the opening price. If, on the other hand, you bet on falling prices, the closing price must be below the opening price.
If this condition is met, we look at the next candle. This must trade higher than the trigger candle itself for the bullish variant and lower for the bearish variant. The candle itself should have a larger trading range than the last ten preceding candles (Fig. 4). The stop again lies a few points below or above the trigger candle; the profit target at the next structural level. As a filter we can specify the following:
- You should not trade them if the shadow is very short.
- If you see the formation and it doesn't fall to a structure level, don't touch it.
- If the candle doesn't have the largest trading range, but has already moved strongly in the run-up to the formation, this could be an indication that the trend is continuing.
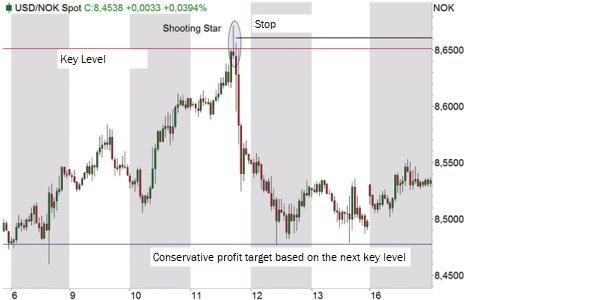
Image 4: The 1-hour chart's USD/NOK showed a Shooting Star (blue oval) forming at the level of the December 15th structural level (red line) and at the end of the bullish trend. This is a kind of inverted hammer. With this candle the movement turned downwards and there was a good opportunity to enter below the next candle. The stop (black line) was a few points above the confirmation candle and the profit target (blue line) was at the next structural level of January 05.
Conclusion
You see, trading doesn't necessarily have to be complicated. What you need is an understanding of the interplay of price action. In fact, the chart already contains all the information you need for your trading decision. All you have to do is "listen" to it, filter its noise and convert its signals. Like any discretionary strategy, this one depends on the trader's experience. So be cautious in the implementation and always pay attention to your risk and money management.
