
The VWAP can be an important support for day traders in assessing the significance of resistance and support areas for liquid equities. This article shows how the indicator works and how traders can apply it in practice.
Why does the VWAP influence daily market activity?
Imagine the following scenario. There sits a large fund manager who has received the order to buy several million shares of a certain stock. Of course, he cannot simply place a market best order in the system, as otherwise the price would explode in the short term and he would achieve a very poor price on average. So the fund manager orients himself on the "fair" price of the share, i.e. the VWAP. In this way he wants to prevent the stock from being bought at too high a price.
Let's assume, then, that the price is just far above the VWAP. Then in most cases the fund manager will not place a purchase order because the price is too high. But if the price returns to the VWAP, he gets a fair price and starts to buy. The price then rises again and experiences a natural bounce away from the VWAP (Fig. 1).
Picture 1: Scheme VWAP Long
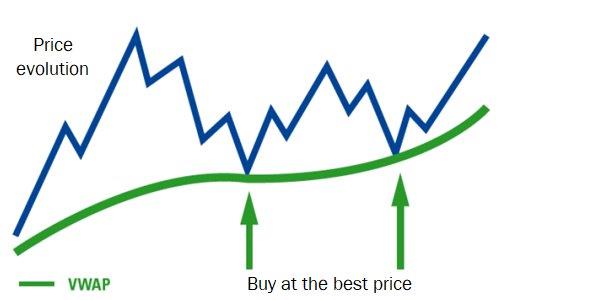
Picture 1: The diagram shows how the VWAP can act as a support during the course of the day.
Vice versa, we also have the scenario on the other side. So let's assume that the fund manager receives a larger sell order or wants to place one. Of course he will try to sell at a fair price and not below. Thus the VWAP will also become a possible resistance during the trading day. The VWAP is particularly significant for heavily traded stocks with a lot of volume. In the case of securities with smaller volumes, where larger orders are rarely placed, the indicator will deliver less good results.
Picture 2: Scheme VWAP Short
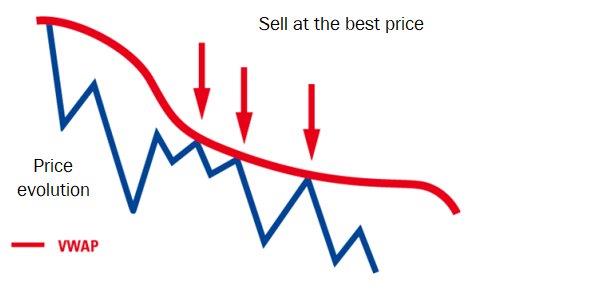
Picture 2: The diagram shows how the VWAP can act as a resistance during the course of the day.
The VWAP in practice
Let's look at a chart of the S&P 500. You can't analyze a S&P 500 index via VWAP, because it is only an indication and has no volume. However, you can remedy this by looking at the ETF SPY SPDR S&P 500 Trust on the index, for example. Figure 3 shows a 15-minute chart on the ETF SPY. It does not matter whether you choose the period 15 minutes, five minutes, 30 minutes or 60 minutes, because the VWAP is displayed the same everywhere on a daily basis. It is nice to see how the indicator repeatedly serves either as resistance or as support during the trading day.
Figure 3: Analysis using VWAP
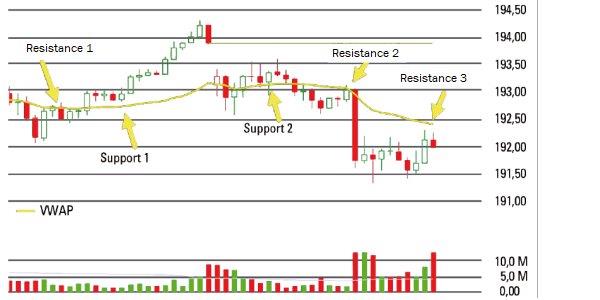
Picture 3: The 15-minute chart of the S&P 500 ETF (SPY) from August 1 to August 5, 2014 shows how the VWAP intraday can act as a clear level.
Conclusions
If the prices are above the VWAP during the trading day, this is a bullish signal and the likelihood of another bullish day is high.
If the prices are below the VWAP during the trading day, this is a bearish signal and the likelihood of another bearish day is high.
Crossing points during the trading day can cause significant trend changes and can therefore be used as a trading signal. For example, you can see in Figure 3 that a buy signal was generated when resistance 1 broke. The price then climbed further upwards throughout the entire trading day. Vice versa you can see the next day that the prices could still develop quite positively at the beginning, but at the latest after the break of support 2 the bears took over the command. After that there was a small impulse downwards and another retest of the VWAP at resistance 2. Here, however, large investors have started to sell again, in the sense of the introductory example. So the price bounced off the VWAP again according to the direction plan and moved further downwards.
As mentioned at the beginning, this indicator cannot be used for every security. So it is important to find out which securities work particularly well and which do not. This, in turn, is the task of each individual trader.
The NanoTrader trading platform, which has won numerous awards, offers more than 100 indicators as well as the VWAP, TWAP, Volume Profile and Volume Viewer.

Test WH SelfInvest, download a free demo.
Trading Examples
Now the author would like to show you a good example from the real world. This is the ETF UVXY ProSharesUltra VIX, which represents a double lever on the volatility index VIX. The author traded this ETF with this simple and at the same time effective strategy several times in the period between the end of July and the beginning of August 2014. The trading plan was as follows:
Go long if we get a closing price above the VWAP on the 15-minute chart and cross it from bottom to top.
The stop loss goes below the low of the triggered 15 minute candle.
Traile the position with a 30-minute stop (below the low of the last 30 minutes).
Once the original risk has been earned, put the stop loss on break even and take partial wins with you.
Now take a look at the chart (Fig. 4). In this August 1, 2014 trade we saw about an hour after market opening how the VWAP was breached upwards to give a buy signal at 31.40. This was the first time the VWAP was breached. Barely two hours later, the position was stopped with a 30-minute trailing stop at 34.73 dollars, which brought an intraday gain of 8.9 percent.
Picture 4: Trading Example 1 (15 minute chart)
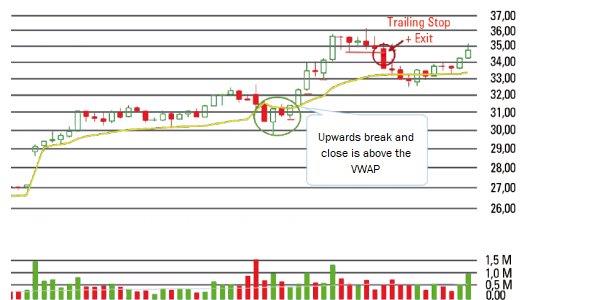

Picture 4: About one hour after market opening on August 1, 2014, the VWAP was breached upwards and opened a buy signal at 31.40 dollars. Barely two hours later, the position was stopped by a 30-minute trailing stop at 34.73 dollars, which brought an intraday gain of 8.9 percent.
A week earlier, there was a similar trade with the same tactics (Figure 5). Here, after a negative opening below the VWAP, we saw the breakout in the first 15 minutes, including the closing price above the indicator, which brought a buy signal. As a result, the trade was abandoned with a stop-loss at 27.30 dollars. So this time we didn't see too long an upward momentum. On the other hand, it is all the nicer to see that the day was over after the VWAP broke down. A bearish pennant formed, including a retest of the VWAP upwards, until the bears took over the helm when the pennant broke downwards and pushed prices significantly.
Picture 5: Trading Example 2 (15 minute chart)

Picture 5: Here, after a negative opening on 28.07.2014 below the VWAP, we saw the breakout including the closing price above the indicator in the first 15 minutes, which brought a buy signal. As a result, the trade was abandoned with a stop-loss at 27.30 dollars.
Bottom line
In summary, it can be said that the VWAP is mainly a help for day traders during the trading day. Of course it can also be used by swing traders, for example if you are looking for a good intraday entry or exit in a stock. At the same time it should be mentioned again that this indicator works especially with liquid securities. Whether one uses a VWAP breakout upwards as a possible long signal or a VWAP breakout downwards as a possible short signal is irrelevant.
