home
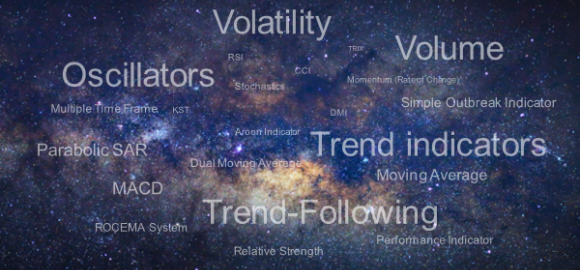
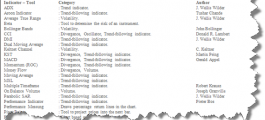
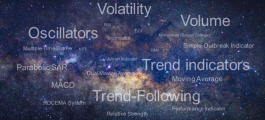
Technical Analysis
A practical guide ...

Everyone wants to know how prices will develop tomorrow and the day after… + Read more

Article 3 - No risk, no reward. This is of course nothing more than a… + Read more
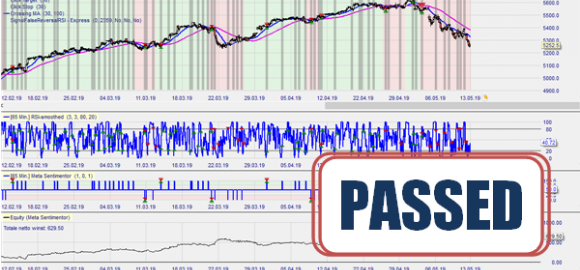
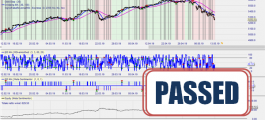
If you are just beginning with technical analysis, then you will be asking… + Read more
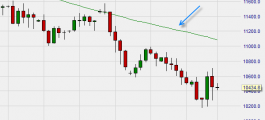
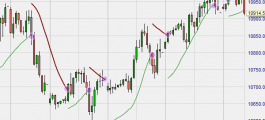
A Moving Average (MA) averages price movements across a given period of… + Read more
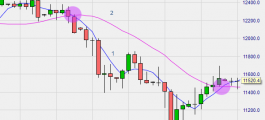
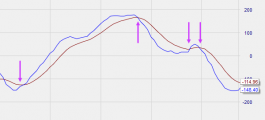
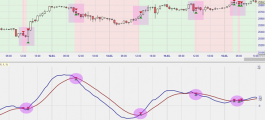
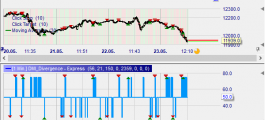
The Dual Moving Average consists of two separate Moving Averages.
… + Read more
Gerald Appel’s Moving Average Convergence/Divergence (MACD) is the… + Read more
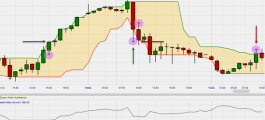
DMI stands for Directional Movement Index. It was developed by J. Wellis… + Read more
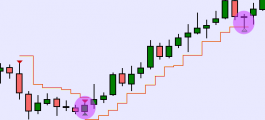
J. Welles Wilder Jr’s Parabolic Stop And Reverse is a sort of moving stop… + Read more
The Moving Stop Loss (MSL) is derived from the previous day’s closing… + Read more
The ROCEMA indicator is a combination of an Exponential Moving Average (… + Read more
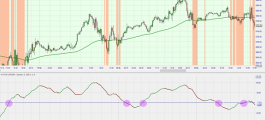
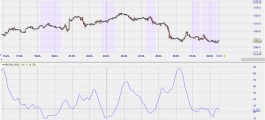
The Aroon indicator, designed by Tushar Chande, is a trend-following… + Read more
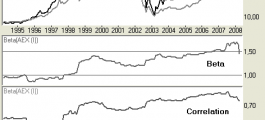
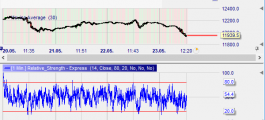
A stock’s Relative Strength (RS) line reflects price movements relative to… + Read more
Martin Pring’s KST indicator comprises a series of exponential moving… + Read more

The Multiple Time Frame (MTF) strategy assumes 2 different time frames.… + Read more
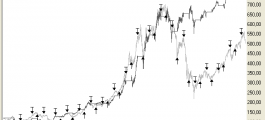
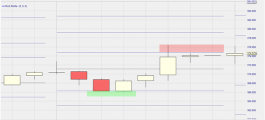
Breakout systems time trades at moments that they reach new highs or lows… + Read more
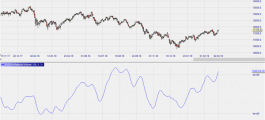
The RSI, or Relative Strength Index, is a popular indicator largely… + Read more
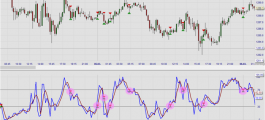
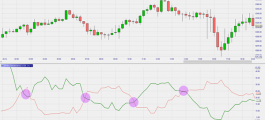
The Stochastics indicator, developed by George Lane, basically consists of… + Read more
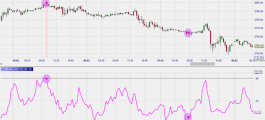
The momentum or Rate of Change (ROC) indicates the increase or decrease of… + Read more
The Commodity Cycle Index (CCI) is a design from 1980 by Donald R. Lambert… + Read more
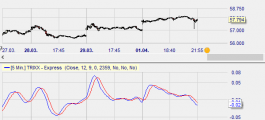
The TRIX indicator, created by Jack Huton, is the 1-day Rate of Change of… + Read more
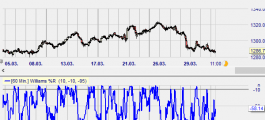
The %R indicator by Larry Williams is similar in principle to Stochastics… + Read more
ADX calculations are based on a moving average of price range expansion… + Read more
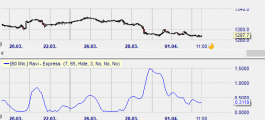
The RAVI (Range Action Verification Index) indicator was developed by… + Read more
The VHF (Vertical Horizontal Filter) was developed by Adam White, and is… + Read more
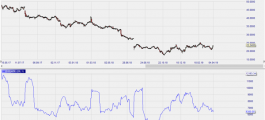
The Money Flow Index, or MFI, is an indicator that displays a stock’s flow… + Read more
Joseph Granville’s On-Balance Volume indicator deals with prices and… + Read more
A well-known saying among traders is sell in May and go away, but remember… + Read more
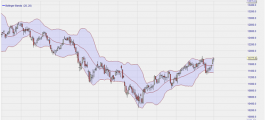
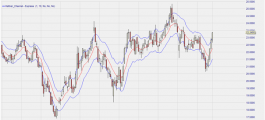
The Bollinger Bands Indicator, named after its inventor John Bollinger, is… + Read more
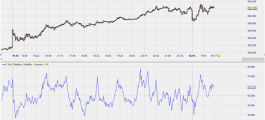
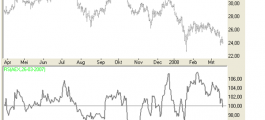
The volatility indicator displays a stock’s historical volatility.… + Read more
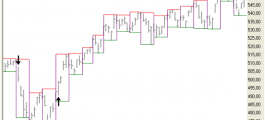
A Range Bar chart is based on price movements and is time independent. A… + Read more
Pivot Points indicate the support and resistance levels for the coming day… + Read more
Performance lines indicate the development of a fixed-income security that… + Read more
The Keltner Channel consists of two bands that are calculated using a 20-… + Read more
Both the Moving Average (MA) and the Directional Movement Indicator (DMI)… + Read more
This technique combines the use of a Moving Average (MA) with Relative… + Read more

The aim of investing is primarily to make money and limit unnecessary… + Read more


Although the concept of money management is quite well known, it is a… + Read more